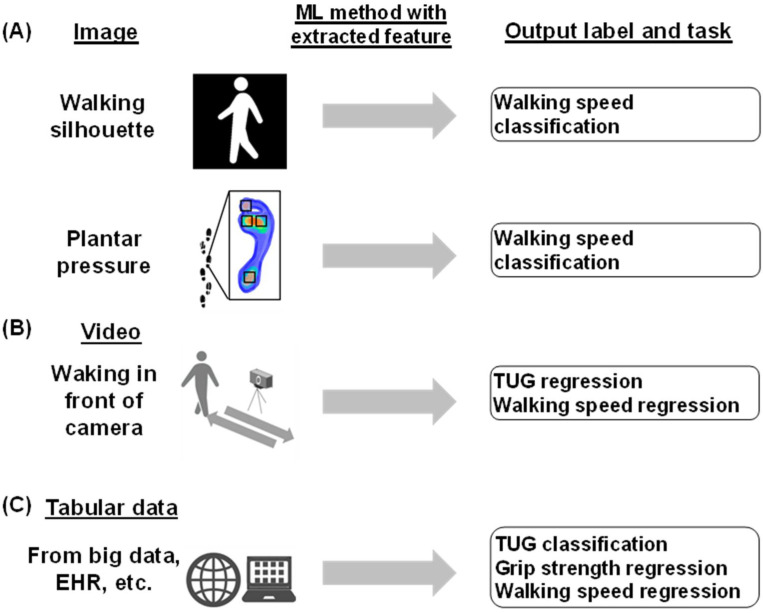
Figure 3.
Utilization of images, videos, and tabular data in assessing physical function. (A) Image: walking silhouettes are used for walking speed classification. These images are from the OU-ISIR Dataset A. Plantar pressure is also used for walking speed classification. Plantar foot pressure images, including the regions of interest (T1, M1, M2, and HL), were classified using a convolutional neural network (CNN) at different walking speeds and times. (B) Video: walking in front of the camera, utilized for TUG and walking speed regression. Common pose estimation models, such as OpenPose and Mask R-CNN, were used for keypoint extraction. (C) Tabular data from big data and EHR, among others; used for TUG classification, grip strength regression, and walking speed regression.

