Figure 1.
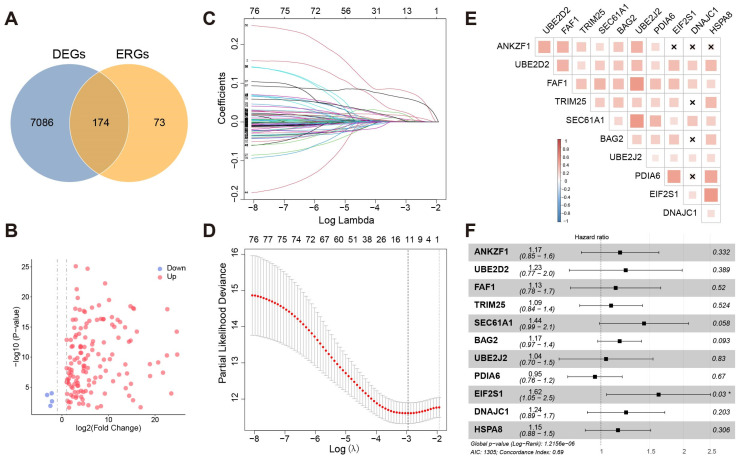
(A) The intersection of differential genes and ERGs. (B) Volcano map visualized differential ERGs in HCC. Red means upregulated genes, and blue means downregulated genes. (C) LASSO coefficient profiles of the 79 hepatocellular prognosis genes. (D) Ten-time cross-validation for tuning parameter selection in the LASSO model. The solid vertical lines are partial likelihood deviance ± standard error (SE). The dotted vertical lines are drawn at the optimal values by minimum criteria and 1-SE criteria. A λ value of 0.052 with log(λ) = −2.956 was chosen by 10-time cross-validation via min criteria. (E) Co-expression of eleven genes. “×”: p > 0.05. (F) Multivariate Cox regression analysis of eleven model genes. “*”: p <= 0.05.

