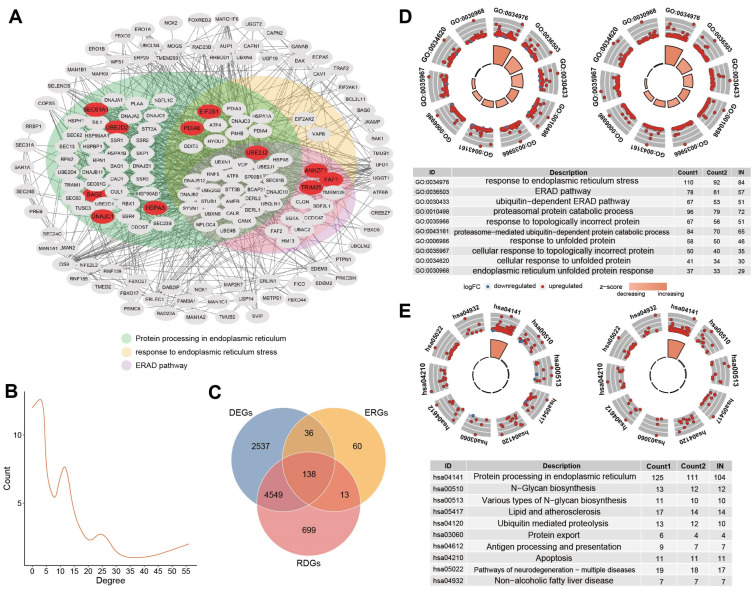
Figure 5.
(A) PPI network of the 174 genes. The default required interaction score was set to a high confidence of 0.700. Model genes were marked in red. The background color of the dots represented the participation pathway. Green represented the hsa04141 pathway, yellow represented the pathway in response to ERS, and purple represented the ERAD pathway. (B) Degree distribution of nodes in the network. The number of nodes tended to decrease as the degree increased. (C) The intersection of ERGs, differential genes, and risk differential genes. The combined number of the three was 138, called the 138 gene set. (D) The figure on the left shows the GO enrichment of differential ERGs, and the figure on the right shows risk differential ERGs. (E) The figure on the left shows the KEGG enrichment of differential ERGs, and the figure on the right shows risk differential ERGs.

