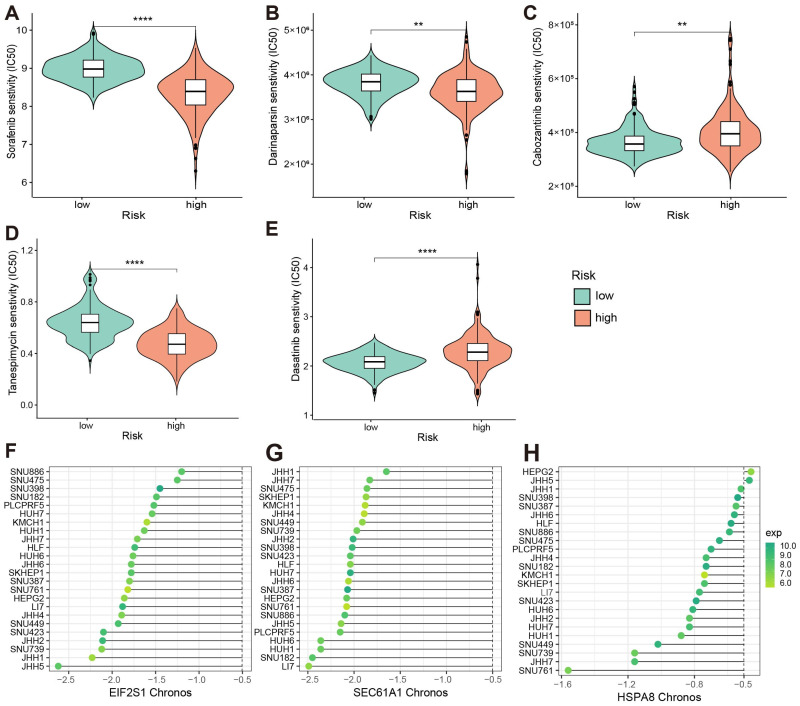
Figure 6.
(A–E) Comparison of drug IC50 values in high- and low-risk populations. The lower the IC50 values, the more sensitive the drug. For the symbolic marking of statistical significance, “**”: p <= 0.01; “****”: p <= 0.0001. (A–C) The IC50 value of drugs targeting liver cancer; (D,E) The IC50 value of drugs targeting the 138 genes set; (F–H) Chronos values and expression values of model genes in different HCC cell lines. (F) EIF2S1; (G) SEC61A1; (H) HSPA8.

