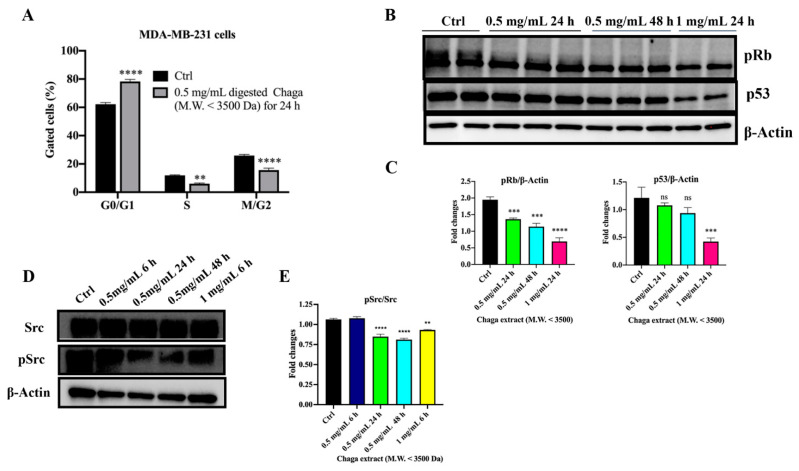
Figure 5.
Digested Chaga extract (MW < 3500 Da) induced cell cycle arrest in the G0/G1 phase in MDA-MB-231 cells. (A) Histograms showing the percentage of MDA-MB-231 cells in the G0/G1, S, and G2/M phases, in the control condition or following 24 h treatment with 0.5 mg/mL of digested Chaga extract (MW < 3500 Da) assessed by FACS cell cycle analysis. Data are presented as the mean ± SD of three repeats. ** p < 0.01, **** p < 0.0001 vs. control. ANOVA followed by Sidak’s multiple comparison test. (B) Representative Western blotting showing the expression of phosphorylated Rb protein (Ser 780), p53, and β-actin (loading control) in MDA-MB-231 cells, left untreated (Ctrl) or treated with 0.5 mg/mL or 1 mg/mL of digested Chaga extract (MW < 3500 Da) for 24 h or 48 h. Twenty micrograms of proteins/well were loaded. (C) Densitometric quantifications of pRb and p53 expression, normalized on β-actin, are shown; data are presented as the mean ± SD of three repeats. *** p < 0.001, **** p < 0.0001. ns: not significant. One-way Anova, followed by Dunnet’s multiple comparison test. (D) Representative Western blotting showing the expression of phosphorylated Src protein (pSrc), Src, and β-actin (loading control) in MDA-MB-231 cells left untreated (Ctrl) or treated with digested Chaga extract (MW < 3500 Da) at the indicated time and concentrations. (E) Densitometric quantifications of pSrc/Src from three independent experiments are shown; data are presented as the mean ± SE of three repeats. ** p < 0.01, **** p < 0.0001. One-way ANOVA, followed by Dunnet’s multiple comparison test.

