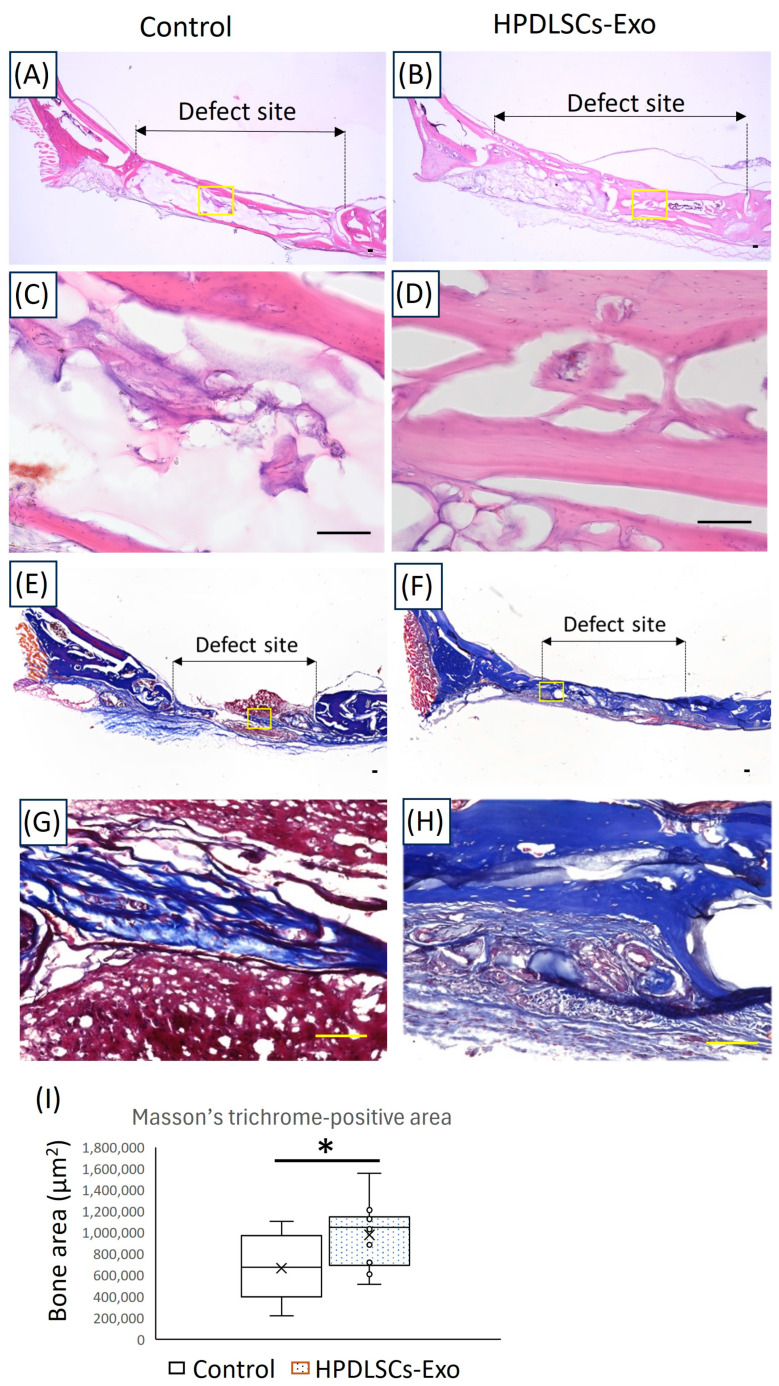
Figure 5.
Histological analyses of the newly formed bone areas at the defect sites in rat calvarial bone. (A–D) Images of calvarial bone defect sites made in 12-week-old rats after 6 weeks of treatment with hydrogel made with PBS (control) or 60 µg/mL of HPDLSCs-Exo (HPDLSCs-Exo) were analyzed after HE staining. Panels (C,D) are magnified images of the yellow boxes in panels (A,B). Scale bars = 100 μm. (E–H) Images of calvarial bone defect sites from rats after 6 weeks of treatment with control or HPDLSCs-Exo were analyzed after Masson’s trichrome staining. Panels (G,H) are magnified images of the yellow boxes in panels (E,F). Scale bars = 100 μm. (I) The areas of newly formed bone at the defect sites in Masson’s trichrome staining (blue) were quantified. n = 5, * p < 0.05.

