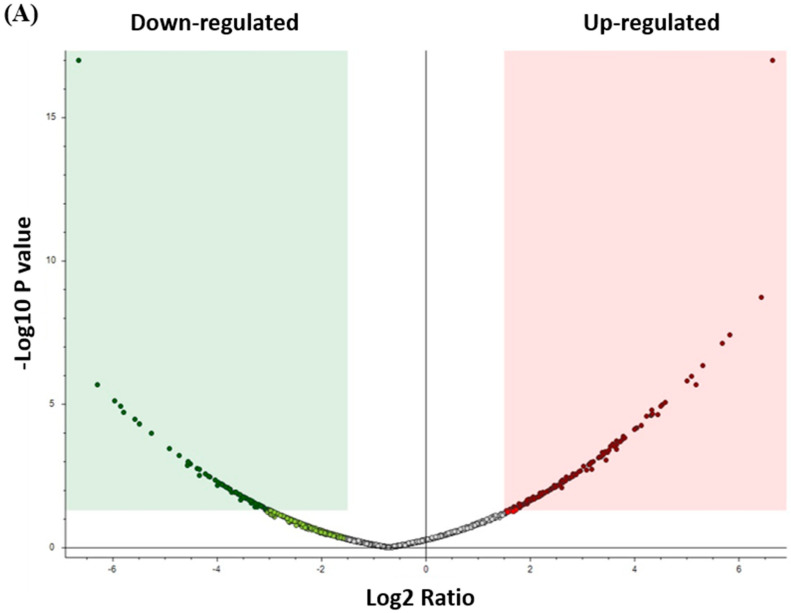
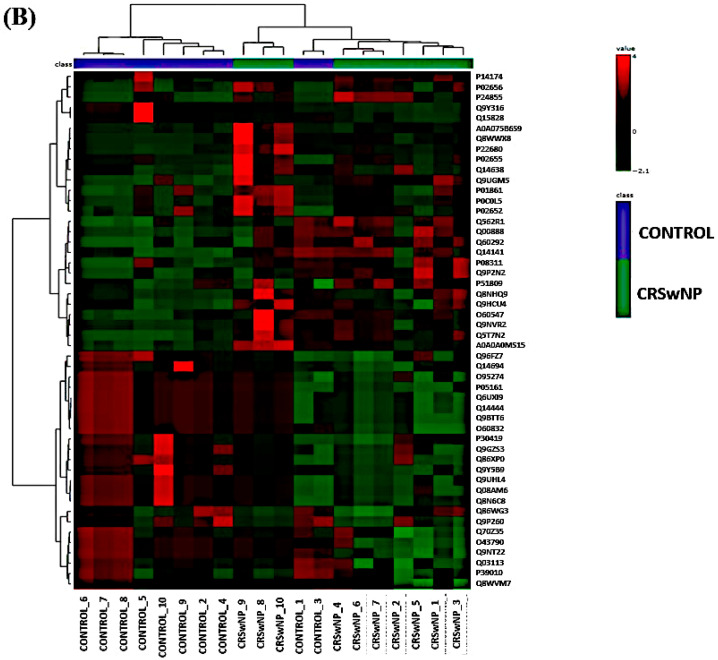
Figure 2.
(A) The volcano plot shows a significant change in the levels of several proteins, of which green represents down-regulated and red represents up-regulated proteins in the control vs. CRSwNP groups (FDR p-value ≤ 0.05-fold change ≥1.5). (B) Hierarchal Clustering (HAC) and heat map analysis of identified proteins that significantly altered between the control and CRSwNP groups. The color range bar indicates down-regulated proteins as green and up-regulated proteins as red.


