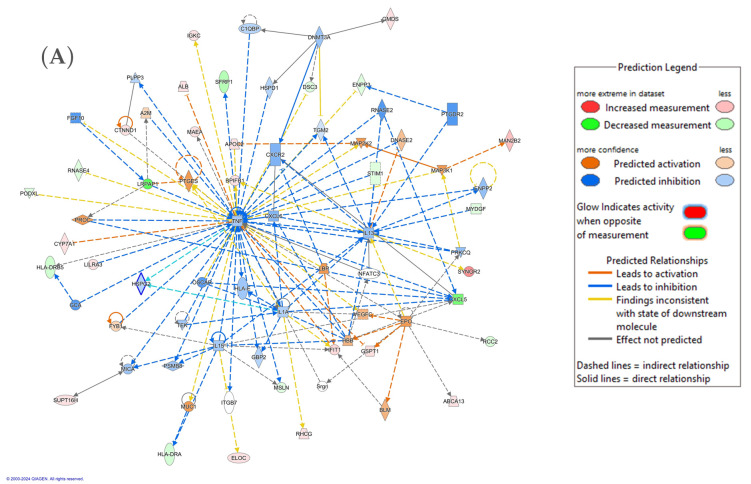
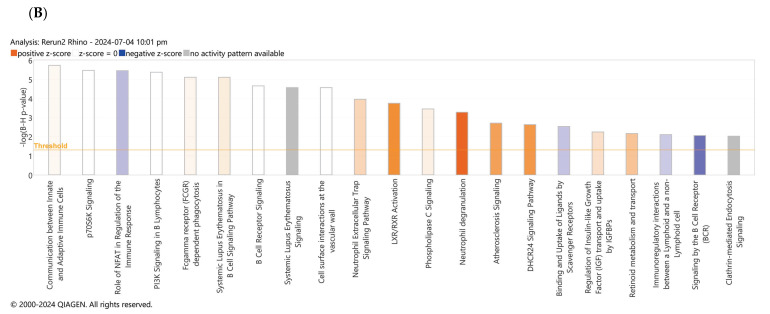
Figure 6.
Schematic representation of the highest-scoring network pathways depicting the involvement of the differentially regulated proteins. Nodes colored blue represent down-regulation, and those colored orange represent up-regulation. (A) Protein interaction network pathway between the CRSwNP and control groups. (B) Top canonical pathways ranked by the p-values obtained by the IPA. Blue bars represent negative z-score, orange bars represent positive z-score, and grey bars represent no activity pattern available. The interaction networks were generated through IPA (QIAGEN Inc., Fresno, CA, USA).


