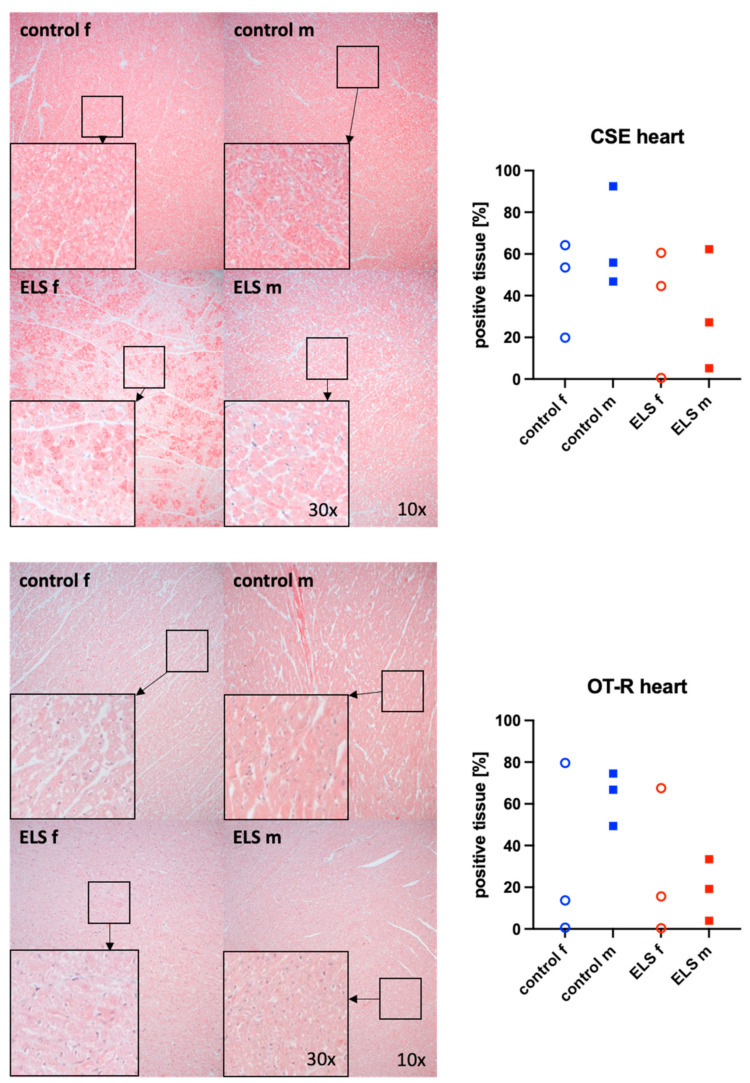
Figure 2.
H2S-producing enzyme cystathionine-γ-lyase (CSE) (upper panel, n = 12) and oxytocin receptor (OT-R) (lower panel, n = 12) in the heart (left ventricle). Representative images (left panel), 30× magnified images originating from the black box in the 10× magnified image and quantification of immunohistochemical staining as positive tissue [pink, %] (right panel). f: female (open circles), m: male (solid squares), ELS: early life stress (red symbols), control (blue symbols).

