Figure 1.
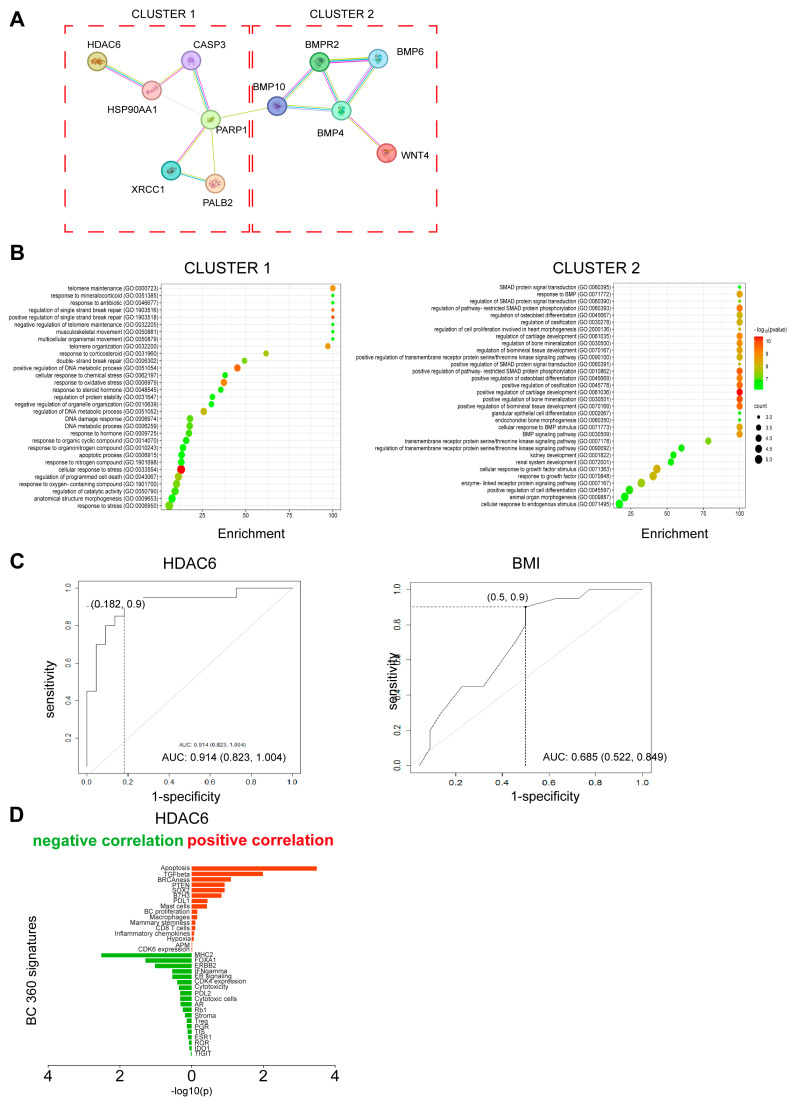
Identification of prognostic markers. (A) Protein–protein interaction (PPI) network of the five medoids based on STRING database. The network nodes are proteins. The edges represent the predicted and known protein–protein associations. Different colored edges represent different associations. Light blue: experimental evidence from the database; purple: experimentally determined; yellow: text mining evidence; indigo: protein homology. (B) Enrichment bubble plot describing the pathways enriched within clusters 1 and 2. Cluster 1 is composed of 6 genes (HDAC6, PALB2, PARP1, XRCC1, CASP3, and HSP90AA1). Cluster 2 is composed of 5 genes (BMP10, BMPR2, BMP4, BMP6, and WNT4). Information on pathway enrichment was retrieved using GO enrichment analysis tools (https://geneontology.org accessed on 6 November 2023). The color scale indicates different thresholds of the p-value, and the size of the dot indicates the number of genes corresponding to each pathway. Bubble plots were obtained using the online free tool SRplot [38]. (C) ROC curve for prediction of disease relapse based on HDAC6 gene expression and on BMI. Curve from the multivariable logistic model. Sensitivity and 1-specificity values were also reported in correspondence with the cutoff obtained by the Youden index. (D) Diagram showing the correlations between HDAC6 and BC360 signatures. Signatures positively correlated are shown in red, and signatures negatively regulated are shown in green. The asterisks indicate the most significant correlation based on p-value and R score (−0.4 ≥ R score ≥ 0.4).

