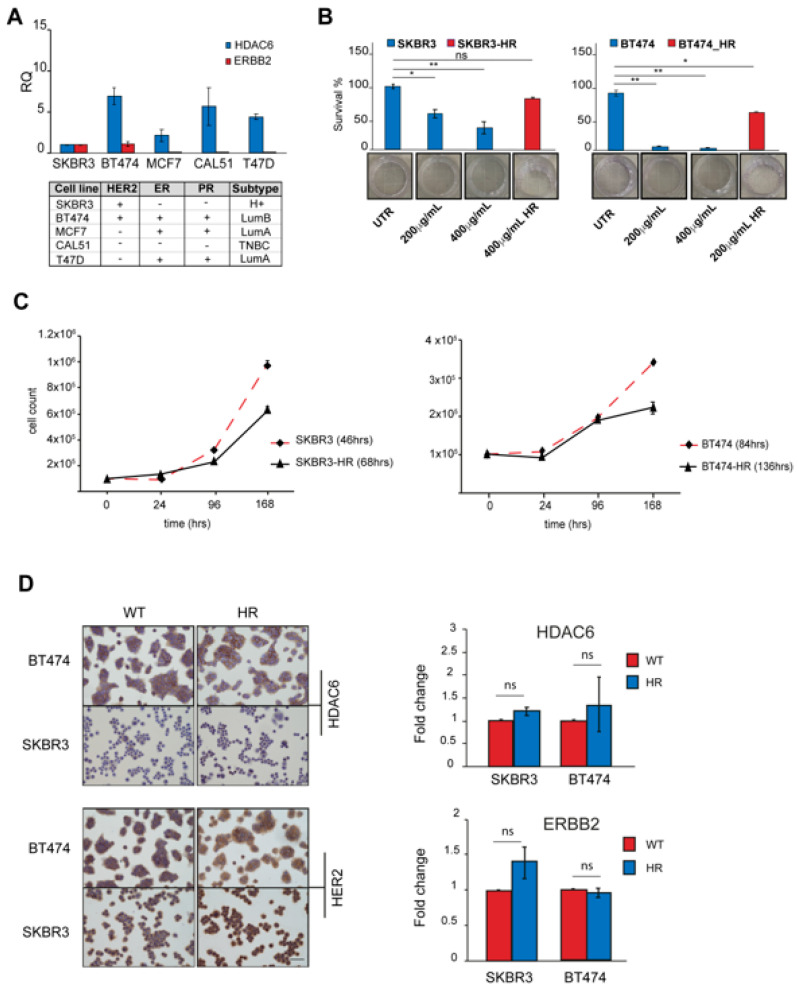
Figure 3.
Generation of trastuzumab-resistant subclones. (A) HDAC6 and ERBB2 relative gene expression analysis performed by quantitative real-time RT-PCR. Expression levels in both genes were normalized to GAPDH, HPRT-1, and ACTB. The bars show RQ ± standard deviation (SD). * p < 0.05; ** p < 0.01. (B) Clonogenic assay. BC cell lines, both WT and HR, were treated with trastuzumab at concentrations of 200 mg/mL and 400 mg/mL for two weeks. Survival fractions were obtained by counting colonies with more than 50 cells by inverted microscope (n = 12 for each time point, mean ± SD; ns: not significant). (C) Cell doubling time (DT). BC cell lines (WT and HR) were counted every day until confluence. Population doubling time was calculated using the formula log2 (Cv/Cs). n = 3 for time point mean ± SD). (D) Left panel: representative images of IHC staining for HDAC6 and HER2 of WT and HR cell lines. Images magnification 20×. Right panel: relative gene expression analysis performed by quantitative real-time RT-PCR. Expression levels of HDAC6 and ERBB2 were normalized to GAPDH, HPRT-1, and ACTB. The bars show fold change ± standard deviation (SD) ns: not significant.

