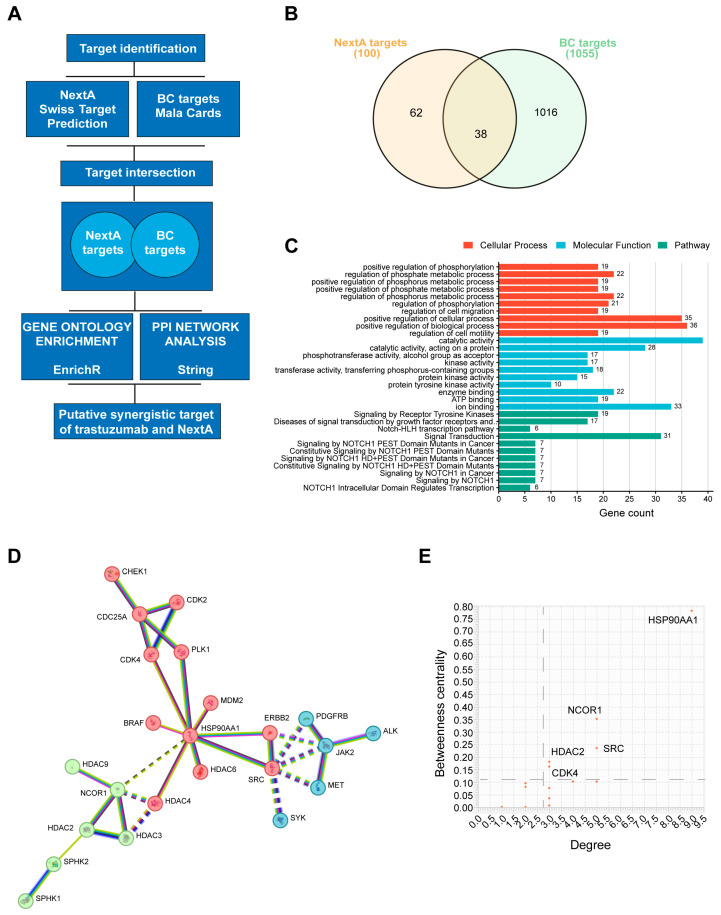
Figure 6.
Network pharmacology. (A) Outline of the tools used for the study. (B) Venn diagram represents the intersection of BC-associated genes and NextA targets. (C) Bar plot showing most significant cellular processes, molecular functions, and pathways enriched with NextA and BC-associated common genes. (D) PPI network map of trastuzumab and NextA targets against BC targets. The unsupervised clustering method, k-means clustering, was applied to identify the clusters. (E) Graph showing the most relevant targets of the PPI network identified by degree and betweenness centrality.

