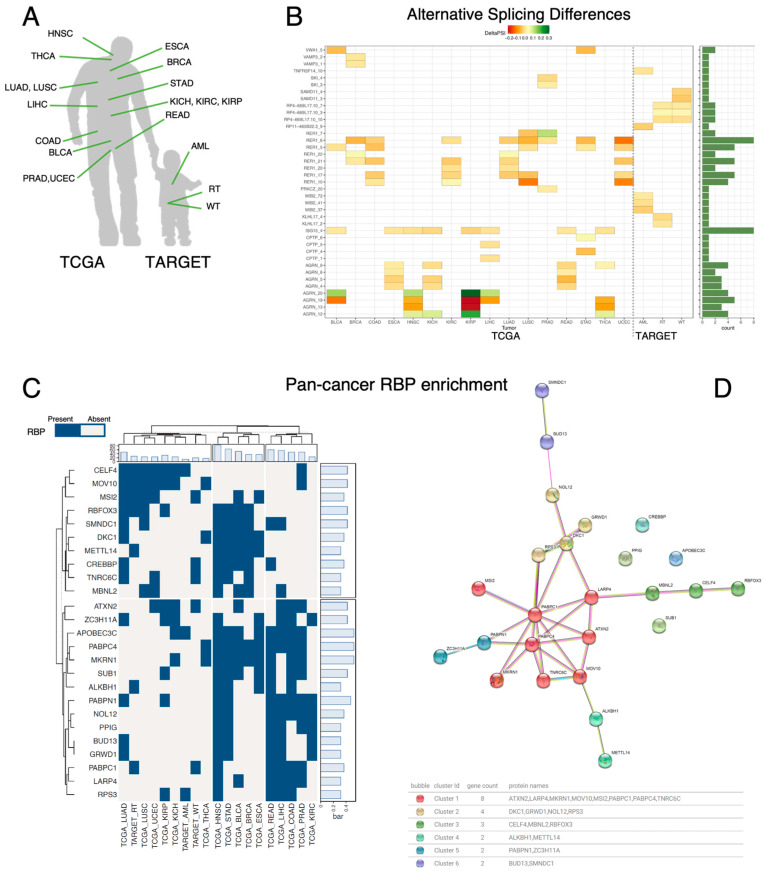
Figure 3.
(A) Tumor types from TCGA and TARGET included in the study, focusing on those with sufficient normal samples. (B) Heatmap of pan-cancer alternative splicing analysis, showing the top five significant splice events per cancer type. The x-axis lists cancer types, the y-axis lists splicing events, with red indicating negative ΔΨ and green positive ΔΨ. (C) Heatmap of 22 RBPs enriched in over 5 tumor types, clustered into two groups, with enrichment shown in blue; includes bar charts of RBP abundance and RBP count per tumor type. (D) STRING clustering of RBPs, with colors indicating clusters, bubbles representing RBPs, and lines showing STRING relationship evidence; includes a cluster description table.

