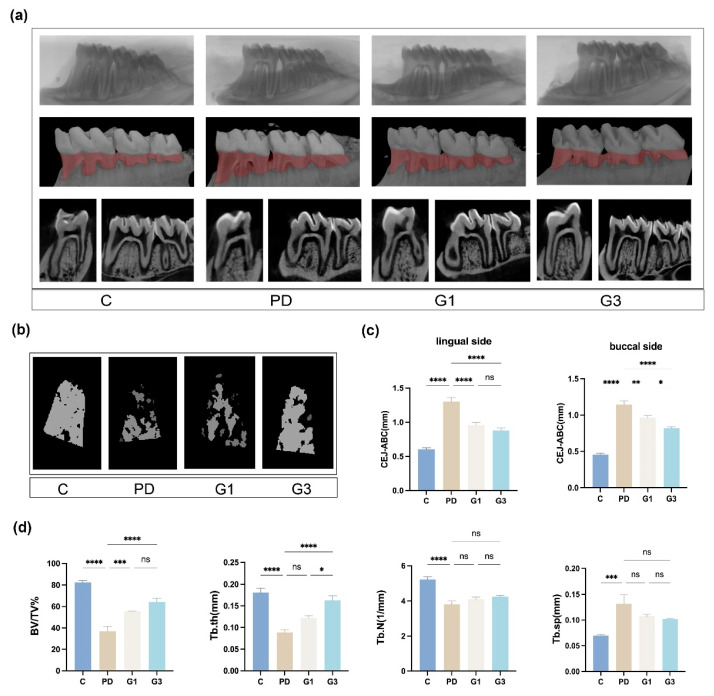
Figure 2.
Alterations in the alveolar bone and the microarchitecture of the trabecular bone after modeling. Three-dimensional and bi-dimensional views of the mandibular molars from micro-CT scanning (a). Reconstructive images in red depict areas of bone loss. The reconstructive images of furcation areas in first molars (b). The distance between the CEJ and alveolar bone crest (ABC) on the buccal and lingual sides (c). Results represent the means ± SEM of 10 samples. Microarchitectural parameters of the alveolar bone (d). Bone volume to total tissue volume (BV/TV%), trabecular number (Tb.N), trabecular thickness (Tb.Th), trabecular separation (Tb.Sp). Results represent the means ± SEM of 10 samples. Statistical analysis was performed with one-way ANOVA. ns, no significance. * p < 0.05; ** p < 0.01; *** p < 0.001; **** p < 0.0001.

