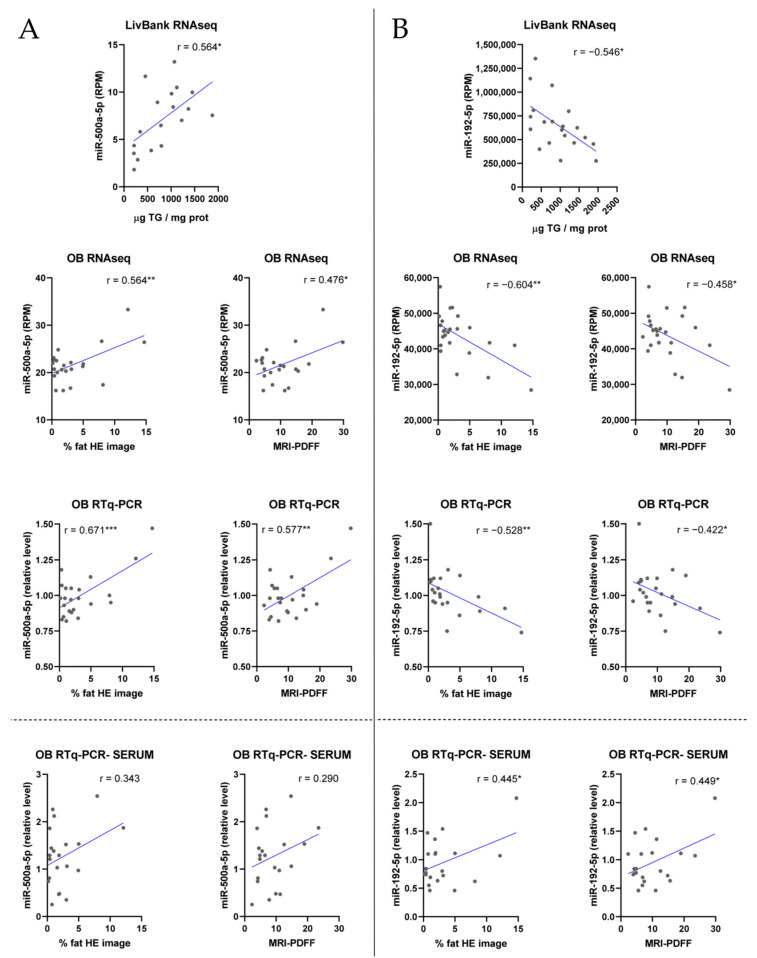
Figure 2.
Correlation of representative liver and serum miRNAs with steatosis. Correlation analysis of miR-500a-5p (A) and miR-192-5p (B) levels in liver (above dotted line) and serum (below dotted line) with steatosis assessed by TG content (liver biobank) or by liver HE-stained biopsy WSI and MRI-PDFF analyses (morbidly obese patients (OB)). *, p < 0.05; **, p < 0.01; ***, p < 0.001.

