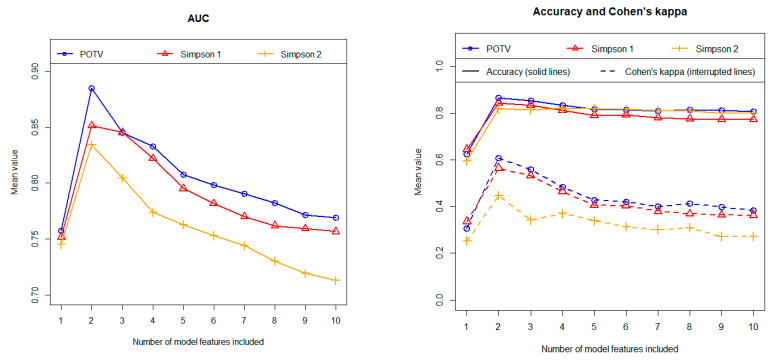
Figure 4.
Prediction of postoperative resection status (GTR/STR) using stepwise logistic regression. Left figure: area under the curve (AUC). Right figure: accuracy and Cohen’s kappa. All results were calculated using independent test data and as mean values of 100 repetitions (100 cycles). Three different definitions regarding the postoperative outcome were tested in terms of their predictability (as indicated in the figures).

