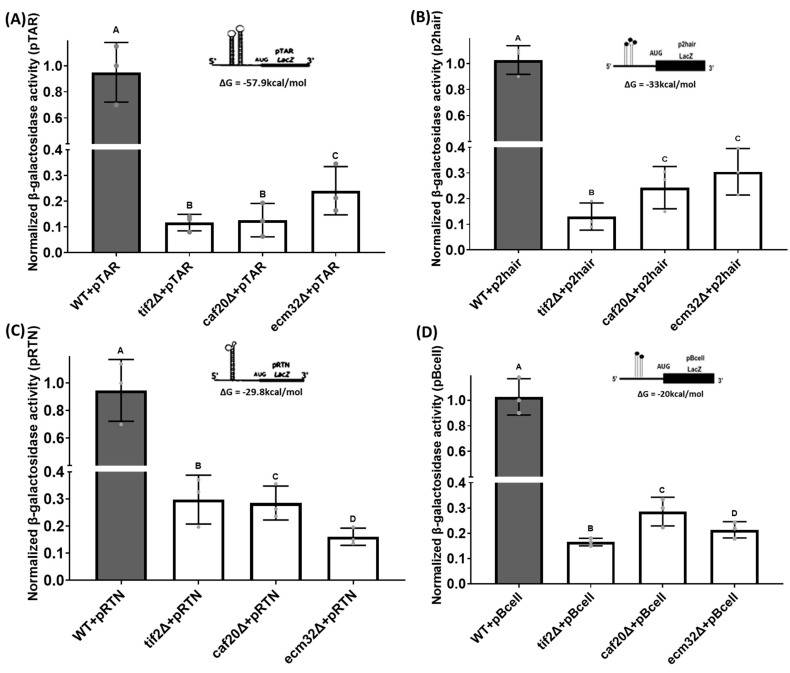
Figure 6.
The quantitative β-galactosidase activity of yeast strains carrying an expression plasmid with different structured 5′ UTRs upstream of the LacZ reporter. (A) All mutant yeast strains that carry a pTAR containing a complex 5′ UTR structure from HIV1-TAR had reduced β-galactosidase activity compared with the wild-type. p-Values of tif2∆ + pTAR = 8.23 × 10⁻⁷, caf20∆ + pTAR = 3.91 × 10⁻⁶, and ecm32∆ + pTAR = 6.30 × 10⁻⁵ were obtained. (B) All mutant yeast strains that carry a p2hair containing a synthetic complex 5′ UTR structure 2hair had reduced β-galactosidase activity compared with the wild-type. p-Values of tif2∆ + p2hair = 1.83 × 10⁻⁷, caf20∆ + p2hair = 9.59 × 10⁻⁶, and ecm32∆ + p2hair = 2.72 × 10⁻⁵ were obtained. (C) All mutant yeast strains that carry a pRTN containing a complex 5′ UTR structure from FOAP-11 had reduced β-galactosidase activity compared with the wild-type. p-Values of tif2∆ + pRTN = 2.45 × 10⁻⁵, caf20∆ + pRTN = 3.96 × 10⁻⁵, and ecm32∆ + pRTN = 5.23 × 10⁻⁶ were obtained. (D) All mutant yeast strains that carry a pBcell containing a complex 5′ UTR structure from BCL-2 had reduced β-galactosidase activity compared with the wild-type. p-Values of tif2∆ + pBcell = 3.13 × 10⁻⁷, caf20∆ + pBcell = 4.55 × 10⁻⁵, and ecm32∆ + pBcell = 1.90 × 10⁻⁵ were obtained. Letters above the bars indicate statistical significance. Bars that share the same letter do not have a significant difference between them, while bars with different letters have a significant difference between them. All experiments were performed in triplicate, and the data are presented as the mean values, with bars representing the standard deviations (SDs). Statistical analysis was performed by using one-way analysis of variance (ANOVA), with multiple comparisons followed by Tukey’s post hoc test. A p-value < 0.05 was considered to indicate statistical significance.

