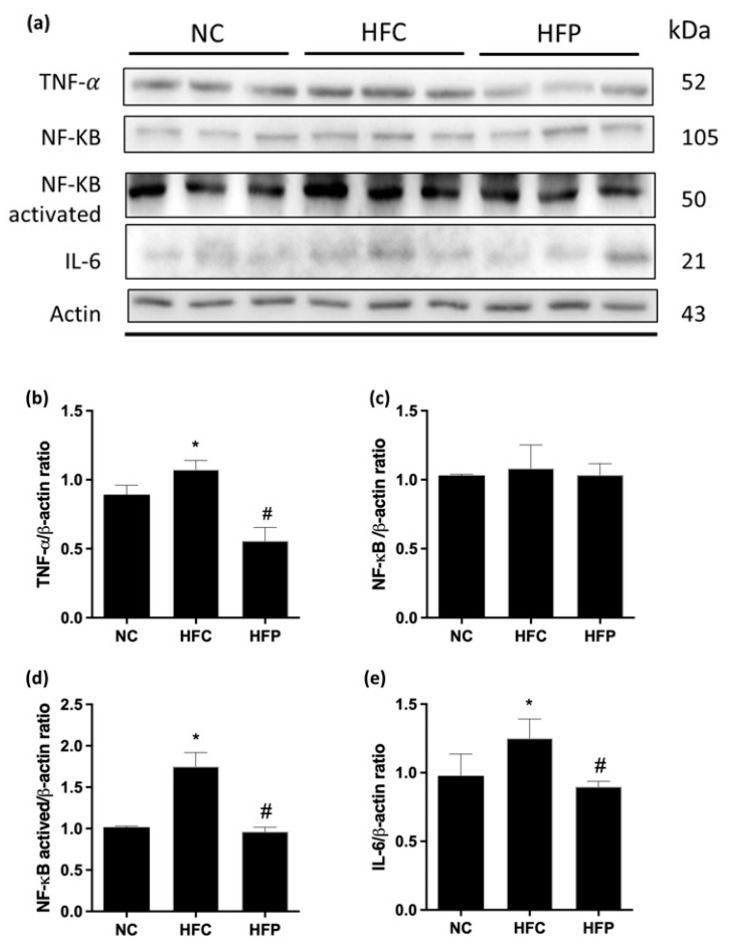
Figure 5.
The effects of a high-fat diet and LP1008 treatment on (a) protein expression in each group (Figure S2) and (b) TNF-α, (c) NF-κB, (d) activated NF-κB, and (e) IL-6 levels in male mice. The data are expressed as the means ± SDs. * p < 0.05 compared with the NC group; # p < 0.05 compared with the HFC group. NC: normal control; HFC: high-fat control; HFP: high-fat diet + LP1008.

