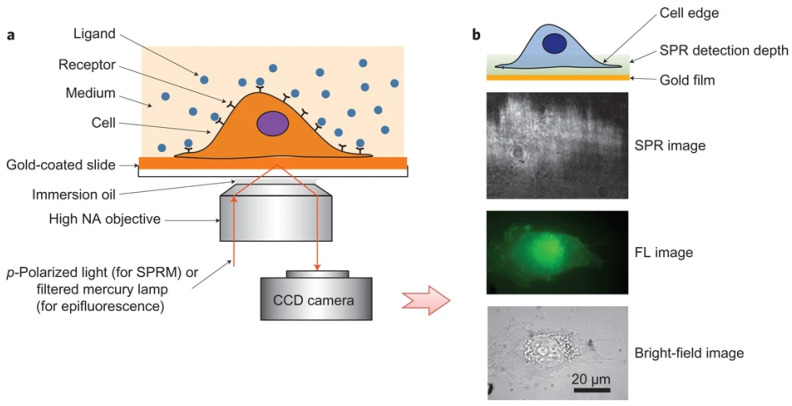
Figure 2.
Schematic diagram of SPRM. (a) Schematic illustration of the experimental set-up. (b) The entire cell bottom membrane and part of the cell top membrane in the cell edge regions are located within the typical detection depth of the SPRM. From the bottom up, examples of bright-field, fluorescence and SPR images, respectively, reprinted with permission from Ref. [30].

