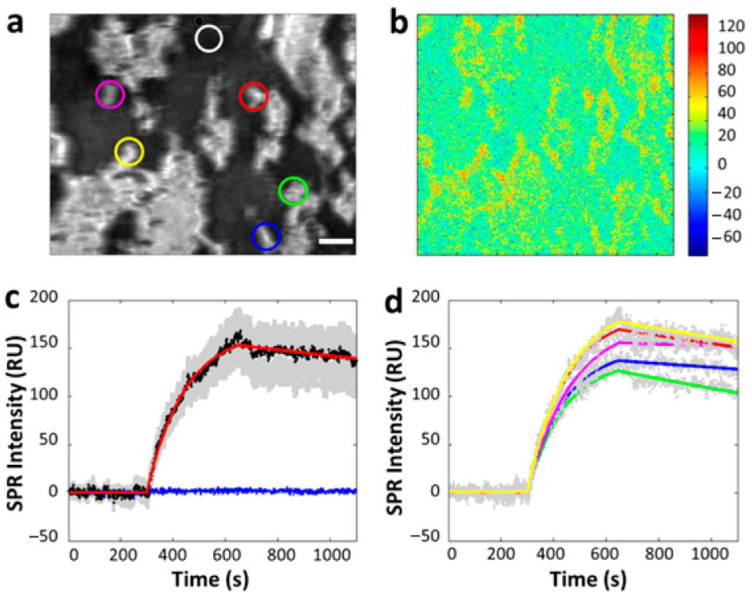
Figure 6.
In situ analysis of EGFR–antibody interactions. (a) A typical SPRi image of a few tens of A431 cells adhered on the gold-coated glass slide. (b) Differential SPR image shows the maximum SPR intensity increase due to anti-EGFR binding to the surface of A431 cells. (c) The average SPR sensorgrams of all cells in view (black curves, average SPR sensorgram; red curve, curve fitting; gray background, cell-to-cell variation) and the surrounding regions without cell coverage (blue curve). (d) The SPR sensorgrams of five individual cells of different regions (gray dotted curves, individual SPR sensorgram; colored curve, corresponding fitting curves of colored circles marked area in (a)), reprinted with permission from Ref. [26].

