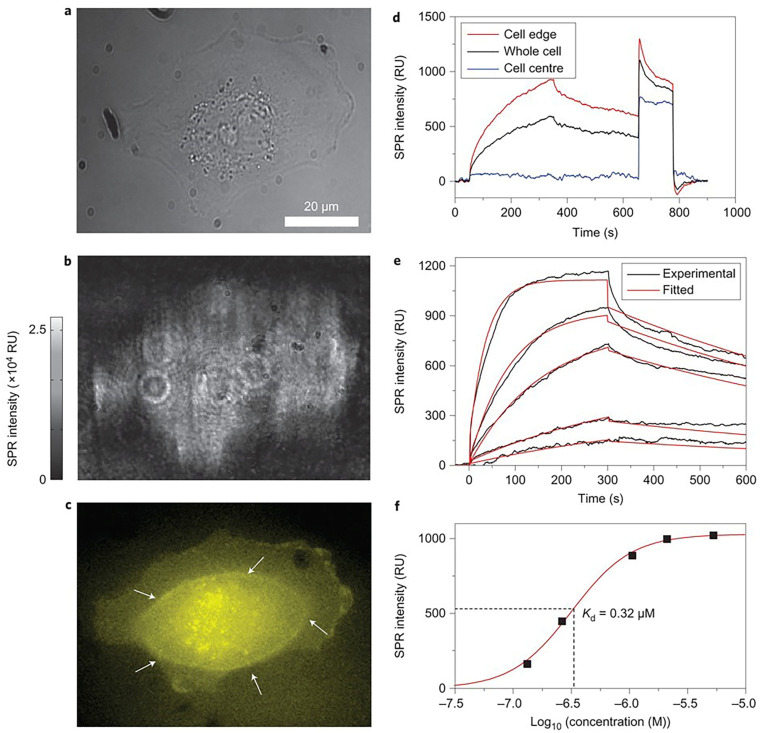
Figure 7.
Single-cell analysis with SPRM. (a,b) The bright-field and SPRM images of a SH-EP1 cell. (c) The epifluorescence image of the same cell stained with Alexa Fluor 555-labeled WGA with a focus on the bottom cell membrane portion (white arrows indicate the borderline between the thick cell body (in the centre) and the thin cell membrane (at the edge)). (d) SPR sensorgrams of the entire cell region (black curve), cell edge region (red curve) and cell central region (blue curve) during the binding and dissociation of WGA. (e) SPR sensorgrams of the cell edge region (black curves) and global fitting (red curves) with WGA solutions of different concentrations. (f) KD was determined as 0.32 mM by plotting the concentration-dependent equilibrium responses, reprinted with permission from Ref. [30].

