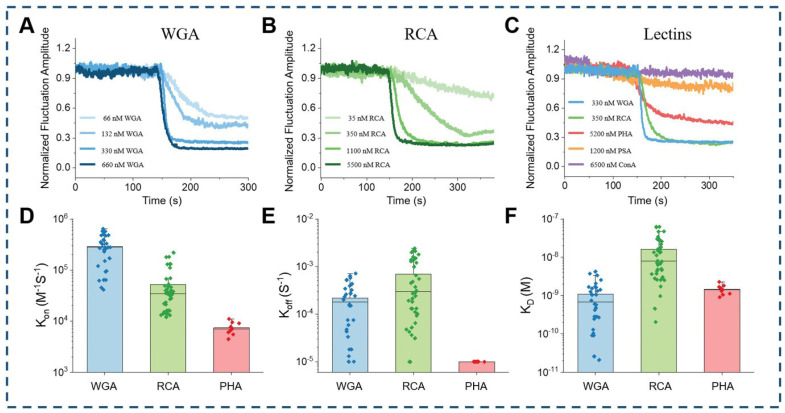
Figure 8.
In situ analysis with edge tracking approach. (A) different concentrations of WGA, (B) different concentrations of RCA, and (C) different lectins (WGA, RCA, PHA, PSA, ConA). (D) Statistical results of associate rate constant, (E) dissociate rate constant, and (F) dissociation constant for three lectins (WGA, RCA, PHA) with obvious binding interaction with red blood cells, reprinted with permission from Ref. [41].

