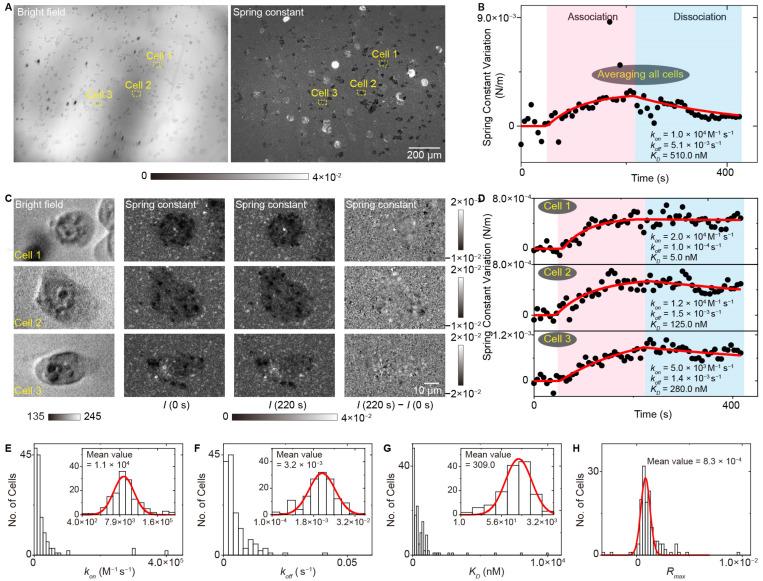
Figure 12.
High throughput and in situ analysis of small-molecule ligands interacting with membrane proteins with ESM. (A) Bright field image and spring constant map of live A431 cells. (B) The spring constant variation against time achieved by averaging the signal of all cells within the field of view. (C) Zoomed views of marked region at 0 s and 220 s after changing the flow to 1 μM erlotinib, and the differential image. (D) The spring constants variation against time achieved from the cell in marked zone in (A). (E–H) Statistical distributions of the association rate constant, dissociation rate constant, dissociation constant and maximum response value in the binding curves, reprinted with permission from Ref. [44].

