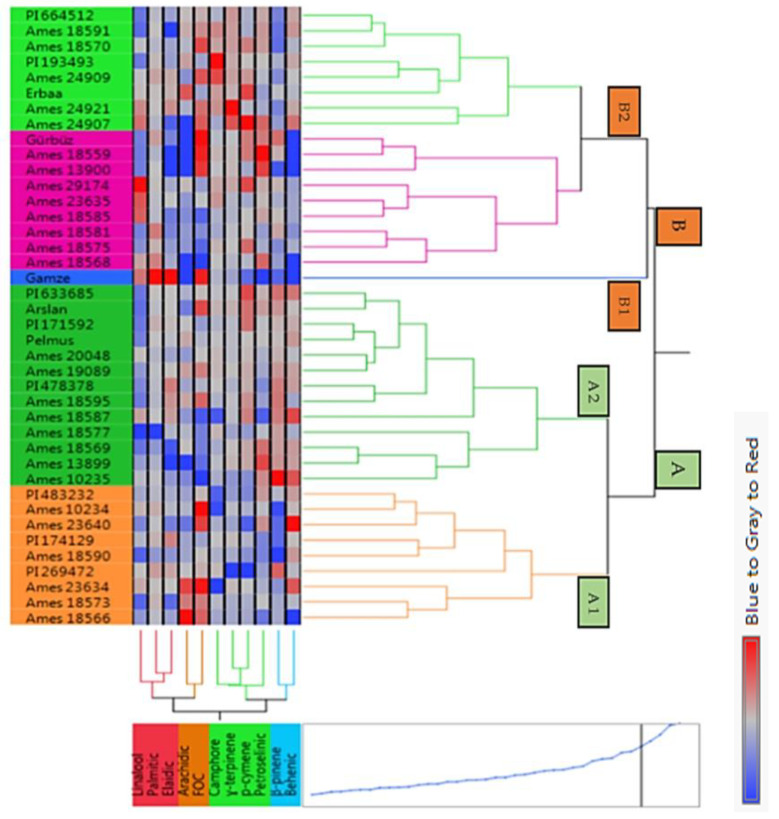
Figure 2.
Cluster analysis result of the different origin high-yielding coriander genotypes depending on the examined properties. Blue to grey to red colors show the difference among the examined properties and genotypes. Red and light shades of red colors indicate higher data values, and light shades of blue to blue colors represent lower data values.

