Figure 3.
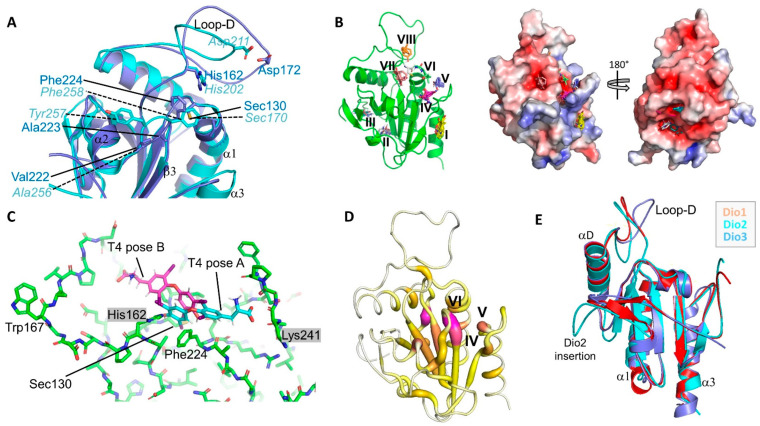
The Dio substrate binding site. (A) Overlay of the active site regions of Dio2 (blue) and Dio3 (cyan). Key residues and secondary structure elements are labeled. (B) Preferred interaction sites for small molecule probes on Dio2, identified with FTmap. Left: Cartoon presentation with sites numbered. Right: Front and back view of the Dio2 surface colored according to electrostatic potential (calculated with APBS; red: negative potential, blue: positive). (C) Active site region of Dio2, with the ligand T4 modeled manually in two orientations: pose A with the carboxylate in site IV (see panel B), and pose B with the carboxylate in site VIII. The residues corresponding to the previously suggested mDio3 substrate clamp are indicated by gray boxes. (D) Ribbon presentation of Dio2 colored according to the CryptoSite score (scale from 0 to 25). Highest scores are shown in magenta/fat ribbon, lowest scores in white/thin ribbon. (E) Overlay of the crystal structures of mDio2 (cyan) and mDio3 (blue) catalytic domains and a homology model of the mDio1 catalytic domain (red).

