



Abstract
Kidneys are intricate three-dimensional structures in the body, yet the spatial and molecular principles of kidney health and disease remain inadequately understood. We generated high-quality datasets for 81 samples, including single-cell, single-nuclear, spot-level (Visium) and single-cell resolution (CosMx) spatial-RNA expression and single-nuclear open chromatin, capturing cells from healthy, diabetic and hypertensive diseased human kidneys. Combining these data, we identify cell types and map them to their locations within the tissue. Unbiased deconvolution of the spatial data identifies the following four distinct microenvironments: glomerular, immune, tubule and fibrotic. We describe the complex organization of microenvironments in health and disease and find that the fibrotic microenvironment is able to molecularly classify human kidneys and offers an improved prognosis compared to traditional histopathology. We provide a comprehensive spatially resolved molecular roadmap of the human kidney and the fibrotic process, demonstrating the clinical utility of spatial transcriptomics.
Human kidneys filter over 140 L of plasma daily, reabsorb vital nutrients, excrete water and electrolytes and eliminate toxins to maintain the internal milieu1,2. Kidney disease is defined by a decline in glomerular filtration. Chronic kidney disease (CKD) is the ninth leading cause of death3,4. Diabetes and hypertension are responsible for more than 75% of all CKD5.
More than 30 specialized cell types, including epithelial, endothelial, interstitial and immune cells, have been identified in the kidney6,7. The development of single-cell RNA sequencing (scRNA-seq) and single-nuclear RNA sequencing (snRNA-seq), as well as single-nuclei assay for transposase-accessible chromatin sequencing (snATAC–seq), has provided an unprecedented insight into the molecular and cellular composition of healthy mouse and human kidneys, including changes during development and disease8–13. The lack of spatial information impedes the accurate mapping of known cell types, which are only described by their anatomical location. This limitation hampers the interrogation of local gene-expression changes and cell–cell communication, both of which have a vital role in maintaining cellular health and can be dysregulated in disease.
CKD is associated with a complex change in the kidney’s cellular structure14. Some histologic changes are specific for disease subtypes; for instance, diffuse thickening of the glomerular basement membrane is observed in diabetic kidney disease (DKD)15. However, fibrosis is a common manifestation across all forms of progressive CKD. The histologic hallmark of fibrosis is the accumulation of extracellular matrix (ECM)16,17, which has been the primary focus of most prior studies18–22.
One of the most substantial clinical problems is identifying patients who will develop end-stage renal failure, requiring either a transplant or dialysis. Clinical parameters, including estimated glomerular filtration rate (eGFR) and albuminuria, can predict kidney function decline with modest accuracy for patients with advanced CKD stages23–25. However, for patients in the earlier stages of the disease, accurate prognosis remains a challenge24. Although some studies suggest that the severity of fibrosis can serve as a predictor, this finding has not been consistently reproduced26–28.
Here we generate both spot (Visium) and single-cell level (CosMx) spatial transcriptomics (SP) data in a total of 4 healthy and 11 diseased human kidneys in conjunction with snRNA-seq/scRNA-seq and snATAC–seq. By combining spatial gene expression with high-quality single-cell expression and open chromatin information, we resolve the identity of cells previously only known by their spatial localization. Moreover, we perform a detailed spatial and cellular characterization of tissue fibrosis. We demonstrate the cellular heterogeneity of the fibrotic stroma, which includes not only fibroblasts and myofibroblasts but also endothelial cells and immune cells that follow the organization of a lymphoid organ and are anatomically close to iPT cells. We define various tissue microenvironments (MEs), including the fibrotic microenvironment (FME). Ultimately, our data show that the FME-gene signature can classify kidney samples and predict future kidney function decline.
Results
A comprehensive multi-omic single-cell map of human kidneys
We generated a comprehensive human kidney single-cell atlas with a spatial resolution by analyzing 81 human kidney tissue samples from 58 participants (62% male and age of 64.1 ± 14.0 years). Samples were divided into the following two groups: (1) healthy control (n = 36) determined by eGFR > 60 ml min−1 1.73 m−2 and fibrosis score of <10%, and (2) CKD (n = 45) determined by (eGFR) < 60 ml min−1 1.73 m−2 or kidney fibrosis score of >10%, including 20 with the clinical histopathological diagnosis of DKD and 25 with the clinical diagnosis of hypertensive-attributed CKD. Supplementary Table 1 shows the demographic, clinical and histological characteristics of the samples.
We performed droplet-based single-cell analysis using 10X Chromium Next GEM for scRNA-seq/snRNA-seq (n = 47) and snATAC–seq (n = 18). After standard processing and meticulous quality control (Supplementary Fig. 1 and Supplementary Table 2), during which we removed low-quality cells, we included 338,565 cells/nuclei in our final atlas. We used SCVI tools to generate a single unified comprehensive integrated human kidney atlas including all different modalities and disease states29. Overall, we identified six cell superfamilies: endothelial cells, stromal cells, tubule epithelial cells, immune cell types, glomerular cells and neural/Schwann cells. Within these large families, we identified 44 main and 114 distinct cell subtypes or states in healthy and diseased human kidneys (Fig. 1a). Key cluster-specific gene markers are shown in Extended Data Fig. 1 and Supplementary Tables 3–12. Our single-cell and single-nuclear human kidney atlas captured kidney cell types in healthy and diseased states in all anatomical regions of the kidney. The main identified cell types were as follows: podocytes, different types of proximal tubule (PT) segments 1–3 (PT_S1, S2, S3 and injured), descending thin loop of Henle, ascending thin loop of Henle, cortical and medullary thick ascending loop of Henle (C_TAL and M_TAL), distal convoluted tubule (DCT), connecting tubule (CNT), principal cells of collecting duct (PC), intercalated cells type α and β (IC_A and IC_B), stromal, endothelial and different types of immune cells.
Fig. 1 |. Comprehensive integrated multimodal human kidney single-cell atlas.
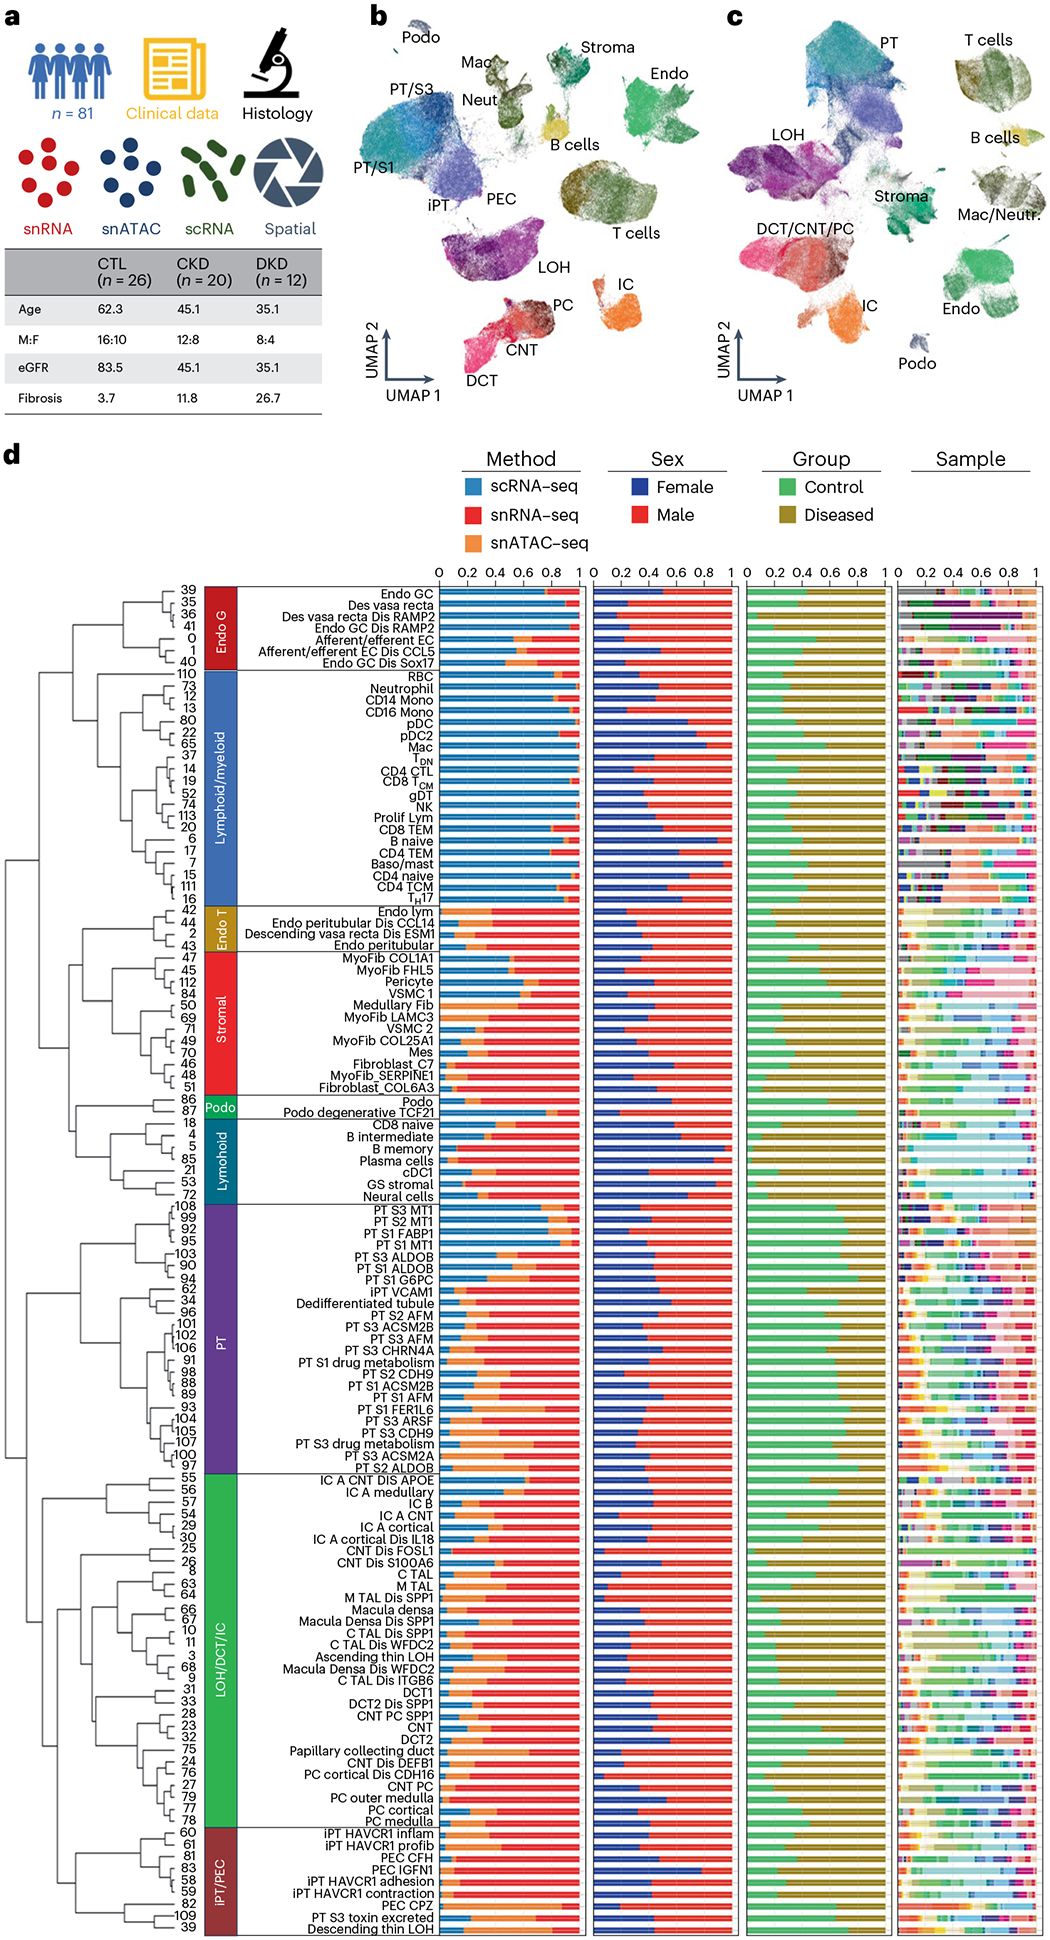
a, Overview of the multimodal analysis. Basic clinical characteristics of the samples. b, UMAP of 338,565 cells/nuclei in an integrated human kidney snRNA-seq/scRNA-seq and snATAC–seq data generated in this study. Annotated cell types are indicated on the plot. c, UMAP of 588,425 integrated human kidney snRNA-seq/scRNA-seq and snATAC–seq data from the present study and KPMP30. d, Hierarchical subclustering identified 114 distinct cell types or cell states. The bar charts depict the relative abundance of each group (method, sex, group and samples) contributing to the cluster. Endo_G, endothelial cells of glomerular capillary tuft; Endo_peritubular, endothelial cells of peritubular vessels; Endo_lymphatic, endothelial cells of lymphatic vessels; Mes, mesangial cells; GS_stromal, glomerulosclerosis-specific stromal cells; Podo, podocyte; DTL, descending thin loop of Henle; NK, natural killer cells; TDN, double-negative T cells; Prolif_lym, proliferative lymphocyte; gDT, γδ T cells; B_naive, naive B lymphocyte; B_memory, memory B lymphocyte; RBC, red blood cells; Baso/mast, basophil or mast cells; pDC, plasmacytoid dendritic cells; cDC, classical dendritic cells; Mac, macrophage; CD14_Mono, monocyte CD14+; CD16_Mono, monocyte CD16+; CTL, control.
The combination of single-cell and single-nuclear methods, the large number of analyzed cells, the high-quality dataset and the inclusion of samples with different degrees of kidney disease severity in our kidney atlas enabled the capture of rare cell types. We captured 11 different types of endothelial cells, including afferent, efferent arterioles (FBLN5+) and vasa recta (MCTP1+) cells (Fig. 1b,c, Extended Data Fig. 1 and Supplementary Fig. 2). We could also identify rare erythropoietin-producing cells within the stromal cell population (Supplementary Fig. 2). We captured PT cells expressing high levels of SLC47A2, a gene-specific for toxin excretion (Extended Data Fig. 1, Supplementary Fig. 2 and Supplementary Tables 11 and 12), and tubule epithelial subtypes mostly seen in diseased kidneys that were positive for IL-18, WFDC2, SPP1 and ITGB6. Our atlas provides a comprehensive reference for human kidney immune cells. We identified lymphoid (T lymphocytes CD4+ (CD4T), T lymphocytes CD8+ (CD8T), natural killer cells, double-negative T cells, TH17, B_naive, B_intermediate B_memory and plasma_cells) and myeloid cells (neutrophil, basophil/mast cells, CD14_monocyte, CD16_monocyte, macrophage, classical and plasmacytoid dendritic cells). We provide comprehensive hierarchical clustering, including information on sex, disease status, sample identity and analytical methods (Fig. 1d).
To further improve and validate our cell type and state identification, we integrated our human kidney atlas with the human kidney precision medicine project (KPMP) dataset30 (Fig. 1c, Extended Data Fig. 2 and Supplementary Fig. 3). This combined fully integrated atlas contains ~600,000 cells or nuclei using three different analytical modalities validating the consistency of the cell-type annotations between datasets (Extended Data Fig. 2 and Supplementary Fig. 3).
In addition to the gene-expression data, the snATAC–seq of 57,847 human kidney nuclei provided us with opportunities to identify transcription factors (TFs) and enriched TF motifs in each cell type. Cell gene-expression markers, a comprehensive list of cell-type differentially accessible regions and TFs can be found in Supplementary Fig. 4 and Supplementary Table 13 and include WT1 for podocyte and parietal epithelial cells (PECs), HNF4A for PT cell types, FOSL2 for injured_PT (iPT) and TFAP2A for C_TAL (Supplementary Fig. 4).
High-resolution spatially resolved human kidney atlas
A key limitation to cell-type identification has been the lack of high-resolution, spatially resolved cell transcriptomics information. To overcome this limitation, we used the Visium FFPE platform and generated 14 spRNA-seq datasets, including 3 control (healthy) and 11 diseased samples (seven DKD and four hypertensive kidney disease (HKD); Supplementary Table 2 and Supplementary Figs. 5–7).
We then leveraged our dissociated single-nuclear/single-cell data to identify cell types within our spatial dataset. First, for the Visium data we used the Cell2location31 package, which is a machine-learning method that estimates the contribution of each cell type to the observed gene-expression profiles. We then used CellTrek32, which uses the dissociated data to impute the spatial location of cell types to near single-cell level (149,717 data points after imputation). The high-resolution data enabled the projection of all identified cell types from the dissociated datasets to their spatial location (Fig. 2a,b). We could also identify markers for cell types previously only known by their anatomical location; for instance, PEC cells expressing CFH and WT1, as well as mesangial cells expressing ITGA8 and POSTN. The gene-expression-based spatial map was consistent with the Human Protein Atlas33 data (Supplementary Fig. 8). Careful examination of the Cell2Location and CellTrek-based cell-type prediction showed the expected anatomical localization (that is, glomerular cells colocalizing at morphologic glomeruli and immune cells localizing with histologic immune infiltrate; Supplementary Figs. 9–11).
Fig. 2 |. Spatially resolved human kidneys.

a, SP data were generated from human FFPE kidney samples using two platforms. Top, Visium uses a spot-based approach with each spot of 55 μm, with the ability to detect >18,000 genes and requires deconvolution to identify the presence of individual cell types. Bottom, CosMx imaging generates single-cell-level data and identifies 1000 genes, which permits annotation of cell types based on the expression patterns of these genes. b, Spatial location and marker gene expression of identified cell types using both Visium and CosMx. H&E sections shown on the left of the figure show individual tissue histology of our Visium sections. Using our calculated Cell2Location scores for each of these tissues, we imputed the presence of cell types on each of these sections with cell-type scores shown in blue overlaying the H&E. We identify glomerular cell types, PT cell types, immune and fibrotic cell types, distal tubular cell types and loop of Henle cell types. To the right of these images, we validated the location of these cell types using the CosMx assay, which allows for individual cell-type annotations that are overlayed on the H&E image of the assayed tissue. All Visium and CosMx samples run are listed in Supplemental Table 1. Endo_GC, endothelial cells of glomerular capillary tuft; GS_stromal, glomerulosclerosis-specific stromal cells; Myo_VSMC, myofibroblast/vascular smooth muscle cells; ATL, ascending thin limb of loop of Henle.
Finally, we then used the CosMx (NanoString) platform to assay human kidney samples (one healthy and one DKD) at true single-cell resolution analyzing the expression of 1,000 genes (Supplementary Figs. 5 and 13 and Supplementary Table 2). The method generated high-quality datasets and distinct Uniform Manifold Approximation and Projection (UMAP) cell clusters that corresponded to specific kidney cell types (Extended Data Fig. 3). The CosMx dataset seamlessly integrated with our snRNA-dissociated cell data, further confirming the proper annotation of cell types (Extended Data Fig. 4). Furthermore, the gene-expression-based cell-type prediction fully matched with anatomical and histological annotation of the slide (Fig. 2b). The processed SP (Visium and CosMx) dataset is fully available for the community and on our interactive website (www.susztaklab.com/hk_genemap/ and https://susztaklab.com/samui/).
Stromal cells heterogeneity and matrix production in fibrosis
We next analyzed kidney fibrosis-associated changes, as fibrosis is the common manifestation of all progressive CKD. We created an ECM score by combining the expression of collagens, glycoproteins and proteoglycans34,35. Figure 3a shows that myofibroblasts, followed by fibroblasts and then vascular smooth muscle cells/pericytes (VSMC/pericyte) had the highest ECM score. We noted that disease samples have a higher frequency of myofibroblasts compared to healthy samples (Fig. 3b), and myofibroblasts were located within a high ECM score area (Fig. 3c).
Fig. 3 |. Human kidney stromal cell atlas.
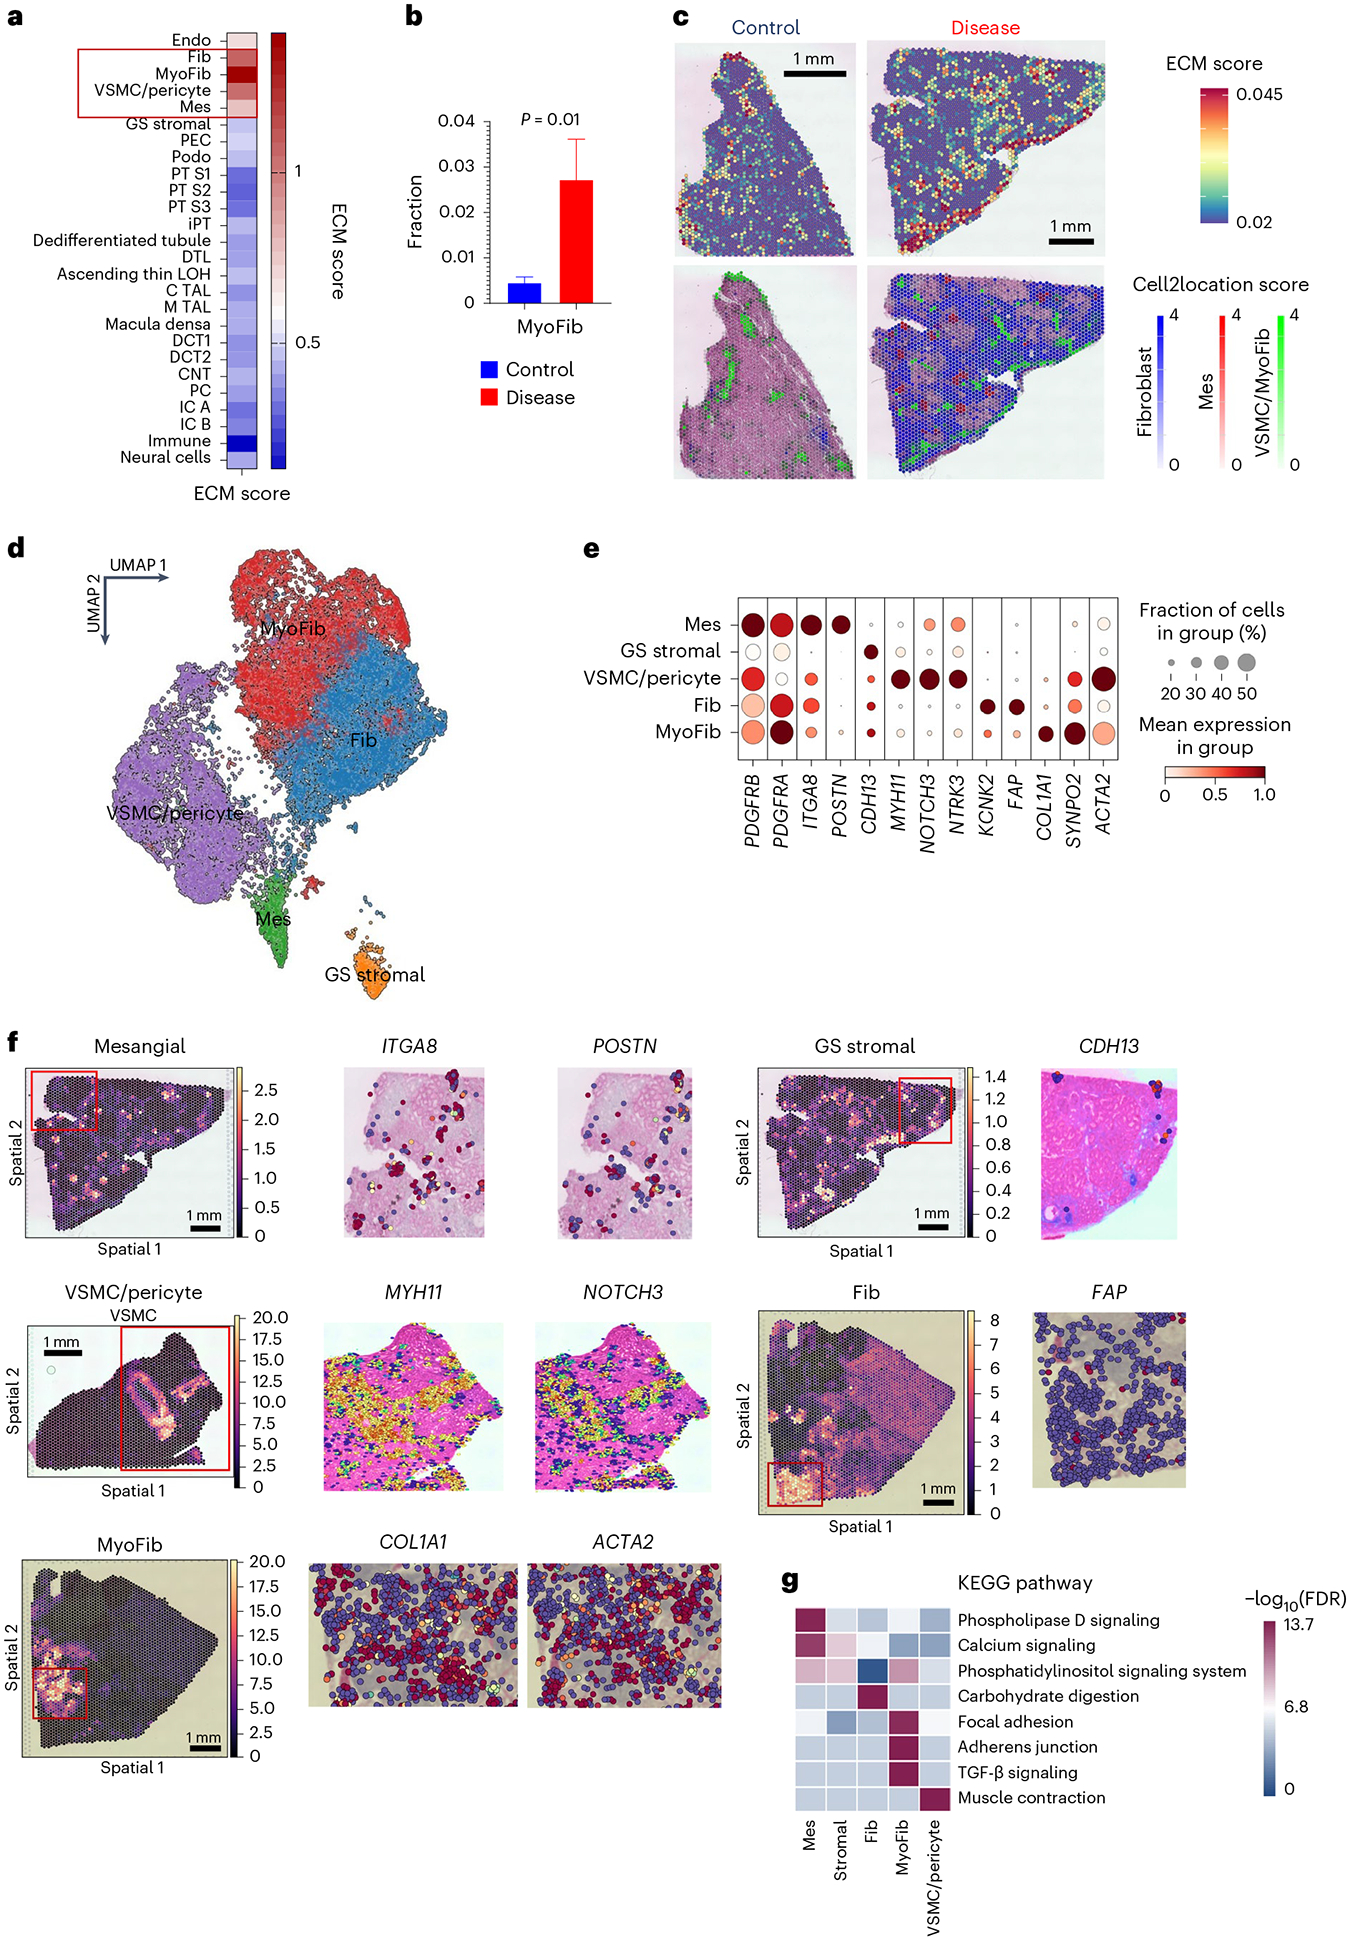
a, ECM gene-expression score in different kidney cell types in the integrated snRNA-seq/scRNA-seq and snATAC– seq. ECM score was calculated based on the expression of collagen, proteoglycan and glycoprotein genes. b, The fraction of myofibroblasts in control and CKD samples. The bars indicate s.e.m. Independent t test was used to compare the fractions between two groups. Each cell was treated as an independent observation, n = 11,169. c, Top, the ECM score in the SP datasets of healthy and CKD samples. Red indicates higher ECM gene expression. Bottom, the location of mesangial cells, fibroblasts, myofibroblasts and VSCMC/pericytes in healthy and CKD samples based on their Cell2Location score. d, UMAP representation of subclustering of 32,706 stromal cells in the integrated dataset from the present study and KPMP. e, The dot plots of marker genes used for stromal cell-type annotation in the integrated dataset. The size of the dot indicates the percent of positive cells, and the darkness of the color indicates average expression. f, The spatial location and stromal cell subtypes and specific marker genes. Left, the relative abundance of each cell type using Cell2location. Right, relative gene expression using CellTrek (red higher). g, The heatmap indicates the −log10(FDR) enrichment of the top KEGG pathways in each stromal cell type. Mes, mesangial cells; GS_stromal, glomerulosclerosis-specific stromal cells; Fib; fibroblast; MyoFib, myofibroblast.
Our combined dataset enabled the identification of stromal cell subtypes that were consistent with prior publications and datasets (Extended Data Figs. 4 and 5) and with correct spatial location (Extended Data Figs. 6 and 7). As previously known, stromal cells were positive for PDGFRB expression. We were able to identify markers for mesangial cells (ITGA8 and POSTN), VSMC/pericytes (MYH11, NOTCH3 and NTRK3), fibroblast (KCNK2 and FAP) and myofibroblast (COL1A1 and SYNPO2; Fig. 3d,e and Supplementary Fig. 14). We validated the consistency of stromal subtypes with prior publications using the MetaNeighbor tool36 (Supplementary Fig. 15) and verified their spatial location (Fig. 3f). The CosMx dataset separated two main stromal clusters, one of which comprised VSMC/pericyte/mesangial cells and the other fibroblasts/myofibroblasts (Supplementary Fig. 14).
Further subclustering analysis of stromal cells distinguished 12 different cell subtypes (Supplementary Fig. 15). We captured medullary fibroblasts expressing SYT1 and NCAM1 and four different myofibroblasts marked by COL1A1+, CLMP+, FGF7+ or ITGBL1+ expression (Supplementary Fig. 15). We could discriminate VSMC from myofibroblasts based on the expression of MYH11, NOTCH3, CNN1 and NTRK3 (Fig. 3f and Supplementary Fig. 14). These annotations were also consistent with protein expression in the Human Protein Atlas (Supplementary Fig. 16) and snATAC–seq analysis (Supplementary Fig. 17). Gene ontology analysis highlighted important differences between the different stromal cells, such as myofibroblasts showed enrichment for focal adhesion, and TGFβ-signaling pathway genes (Fig. 3g). Weighted gene co-expression network analysis (WGCNA)37,38 indicated enrichment for GUCY1A2, LAMA2 and MYO1D in the fibroblast module and COL1A1, ZEB2, SVEP1 and PTEN in the myofibroblast module in disease states (Supplementary Fig. 14 and Supplementary Tables 14 and 15). In the snATAC–seq data, we could identify enrichment for NPAS2, TEAD2 and TCF7 motifs in open chromatin areas in myofibroblasts and USF2 TF motifs in VSMC (Supplementary Fig. 17).
Defining the kidney FME
Our spRNA-seq dataset is uniquely suited to defining ME in the human kidney. We ran nonnegative matrix factorization (NMF) on the Visium datasets using the STutility39 package. We found four major MEs in the human kidney, which visually corresponded to glomerular, tubule, fibrotic and immune regions. Gene ontology enrichment analysis of genes detected in each ME was consistent with their anatomical annotation (Supplementary Fig. 18). The computationally defined FME strongly correlated with kidney ECM gene expression (Supplementary Fig. 19) and our pathologist’s assessment of fibrosis (r = 0.75, P = 0.003; Fig. 4a and Supplementary Fig. 19).
Fig. 4 |. Human kidney FME.
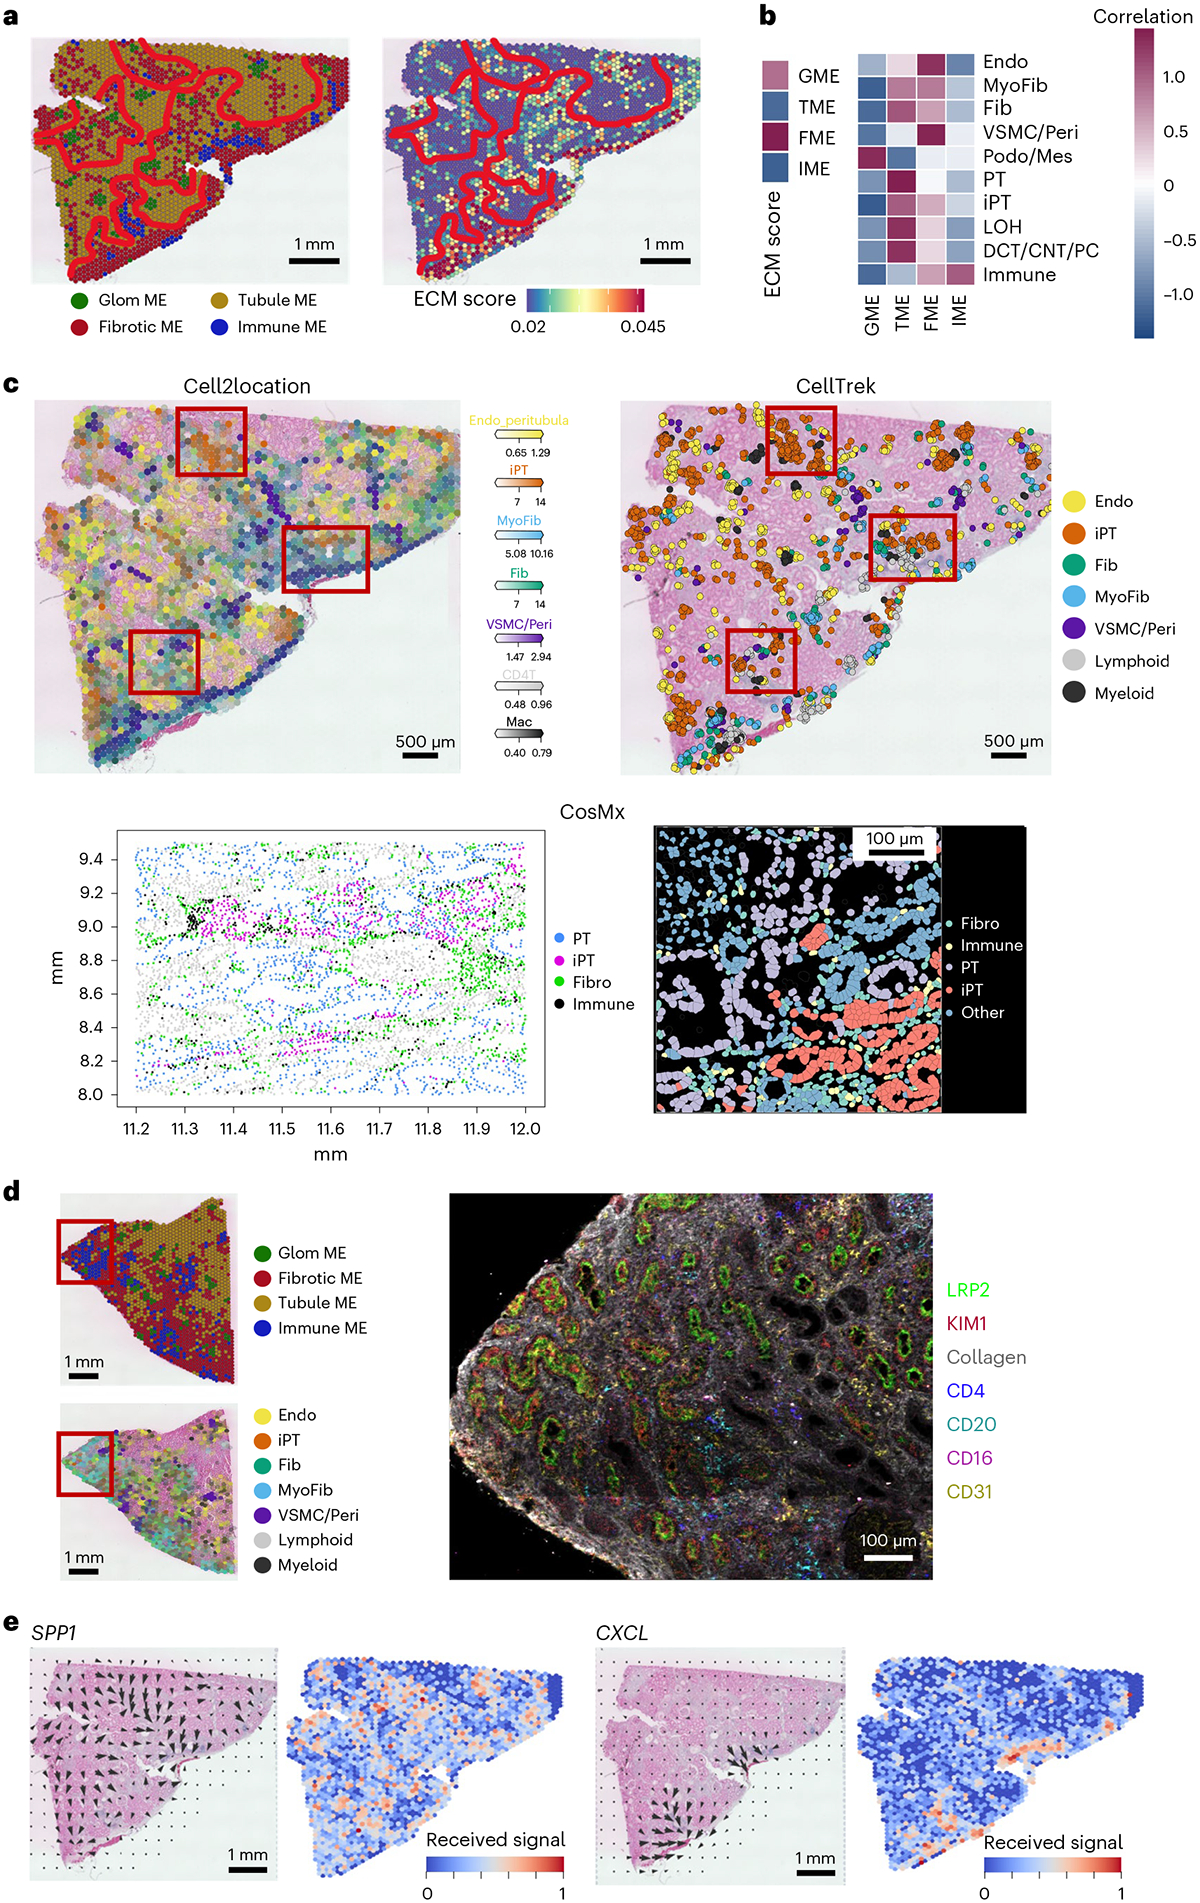
a, Human kidney MEs defined by NMF of the spRNA-seq. Briefly, NMF categorized spots into four groups, which were manually interrogated and found to correspond with glomerular (bright green), tubule (brownish green), fibrotic (red) and immune (blue) signatures. The spatial distribution of the calculated ECM score (right). Red indicates higher ECM gene expression. b, Correlation of ME with ECM score (left) and cell-type correlation with each ME (right). c, Cell2location (left) and Celltrek (right) cell-type imputations of the Visium spatial data and CosMx (below) annotations (below) showing the location of different cell types in the FME in a diseased kidney sample. CosMx annotations of iPT, PT, fibroblasts and immune cells are shown at two different magnifications. d, IMC imaging of CKD kidney (from e) labeled with LRP2 (PT) KIM1 (iPT), CD4 (T cell) CD20 (B cell), CD16 (myeloid) and CD31 (Endo) in a fibrotic human kidney sample. e, The spatial location of the identified cell–cell interaction pathway (SPP1 and CXCL). The arrows indicate the source and targets of the identified pathways, and the color indicates the received signals (red higher). The results were obtained using the COMMOT package. GME, glomerular microenvironment; TME, tubular microenvironment; IME, immune microenvironment; LOH, loop of Henle.
We also identified a specific immune ME. The immune ME regions were located within the FME, but with patchy distribution. The immune ME consisted of dendritic cells, plasma cells, and B and T lymphocytes (Fig. 4b,c and Supplementary Figs. 19 and 20). The immune ME organizations resembled early tertiary lymphoid structures40. Immunostaining studies with cell-type-specific antibodies validated the presence of these specific immune cells and immune cell aggregates (Supplementary Fig. 21). Furthermore, we have performed in situ mass spectrometry (IMC) to understand protein expression levels. Consistent with the Visium data, we confirmed the protein expression of iPT-HAVCR1+ cells, B cells, CD4T cells, plasma, myeloid and endothelial cells by IMC (Fig. 4d and Supplementary Fig. 22).
To further understand cell interactions in FMEs, we implemented CellChat41 on the integrated scRNA-seq/snRNA-seq and snATAC–seq datasets, as well as communication analysis by optimal transport (COMMOT)42 on the spRNA-seq datasets. We found enrichment for SPP1, CXCL12, CCL19, CCL21, PDGFB and TGFB1 and their receptors in FME regions (Fig. 4e, Extended Data Fig. 8 and Supplementary Tables 19–21). The iPT cells in the FMEs expressed SPP1 and PDGFB and showed a strong interaction with stromal cells. Also, we found endothelial cells expressing CD34 and CDH5 in the FME regions (Extended Data Fig. 8). The stromal cells in FME were enriched for chemotactic factors including CXCL12, CCL19 and CCL21, while their receptors were expressed in different immune cells, suggesting that stromal cells might signal to immune cells. We observed PDGFB and TGFB1, known mediators of fibrosis, in FME-associated immune aggregates (Extended Data Fig. 8)42.
Injured tubule cells in human kidney fibrosis
Cell-type enrichment analysis of the FME indicated fibroblast, myofibroblast, immune cells, endothelial cells and injured tubule cells including, injured proximal tubule (iPT) cells in FMEs (Fig. 4b). iPT cells have not been well characterized, but they have been identified in diseased mouse and human kidney samples10,11,43,44. iPT cells were physically close to PT cells (Figs. 5a and 4c and Supplementary Fig. 24). Furthermore, we note that PT cells exhibited the highest number of genes correlating with eGFR and fibrosis and the largest change in cell fraction between disease and control samples (Fig. 5b,c and Supplementary Fig. 23). In contrast, we observed a clear enrichment of iPT cells in the FME and increased number in diseased samples (Fig. 5d). Upon careful subclustering of our CosMx data, we noted VCAM1 expression in both PEC and iPT, while HAVCR1 was specific for iPTs (Fig. 5e and Extended Data Fig. 9).
Fig. 5 |. iPT cells in diseased human kidneys.

a, Localization of iPT and PT cells within control and diseased samples in the human kidney. b, Heatmap of the number of genes correlated with eGFR and renal fibrosis in each cell type. The red shows a higher number of genes, and the blue indicates a lower number of genes. c, Heatmap of cell type fraction changes between disease and control samples; PT and immune cells have the highest fraction differences between disease and control samples. d, The fractions of PT and iPT in control and diseased sample types in the integrated snRNA-seq/scRNA-seq and snATAC–seq dataset. Bar indicated the s.e.m. For the comparison between the two groups, two-sided t-test was used. Each cell was treated as an independent observation, n = 74,326 for PT and 24,595 for iPT. P values for comparison between PT and iPT are P < 0.0001 and P = 0.08, respectively. e, CosMx SP shows that annotation of iPT and PECs localize to tubules and glomeruli, respectively. f, Gene co-expression network analysis of human kidney spRNA-seq data indicates two modules expressing VCAM1 or HAVCR1. Right, the spatial location of VCAM1+ and HAVCR1 (KIM1)+ injured PT cells. The color indicates gene expression of iPT modules (red higher expression). g, Subclustering of iPT cells from the integrated atlas. The fraction of VCAM1+ or HAVCR1+ iPT cells in control and diseased kidneys is shown on UMAP and quantified in frequency. The dot plots show the expression marker genes in iPT and PT cells. h, Cell trajectory analysis (Monocle) representation of PT and iPT cells (top). The heatmap shows the differentially expressed genes along the trajectory, with cells ordered by pseudotime. Red indicates higher expression. i, Subclustering of iPT within the CosMx data shows three subtypes of iPT. These iPT subtypes have different neighboring cells (within a 50-micron radius), with iPT_KRT7 having the most frequent fibroblast and immune neighbors within our diseased sample (P = 1 × 10−177 for fibroblasts and P = 1 × 10⁻¹⁷ for immune cells, respectively, within our disease sample by Wilcoxon rank-sum test). iPT_APOE had fewer immune (P ≤ 1 × 10−310 for HK3039 and P < 1 × 10−310 for HK2844) and fibroblast neighbors than the iPT_SPP1 subtype. (P = 5 × 10−52 for HK3039 and P = 1 × 10−52 HK2844).
We then sought to examine iPT heterogeneity, starting with our Visium data. We used the single-cell co-expression module of CellTrek32. We identified two different iPT modules, corresponding to two iPT subtypes in diseased samples (Fig. 5f) and only one iPT type in ‘healthy’ samples (Supplementary Fig. 25). Moving back to the rich integrated atlas, we found that one of the iPT clusters expressed VCAM1, ACSL1, ASS1 and ASPA, genes having roles in cellular metabolism. We called this cluster iPT_VCAM1+. This cluster was present in healthy samples, and this cluster was close to other injured PT cells in the integrated dataset expressing mitochondrial genes such as MT1 (Fig. 5f). The second iPT cluster expressed HAVCR1 (which encodes KIM1), NFKBIZ, IL-18, ITGA3, PDGFB and ITGB1 and was enriched for the expression of genes associated with cell adhesion and matrix (iPT-HAVCR1+; Supplementary Fig. 25). Both in the Visium spatial and dissociated datasets, most iPT-HAVCR1+ cells were in CKD samples (Fig. 5g). Pseudotime analysis of PT and iPT cells using Monocle indicated a continuous differentiation path of PT cells to iPT_VCAM1+ and iPT_HAVCR1+ (Fig. 5h and Supplementary Table 22). Studies going back a decade have identified HAVCR1 expression as an injured tubule marker10. These two different iPT cell subtypes were also present in a recently published mouse DKD snRNA-seq44 dataset (Supplementary Fig. 26) as well as in our snATAC–seq data (Supplementary Fig. 27). We identified HNF1A and BACH2 as enriched TFs for iPT_VCAM1+ and iPT_HAVCR1+, respectively (Supplementary Fig. 27).
We then subclustered iPT cells using our positionally verified CosMx data (Fig. 5i, Extended Data Fig. 9 and Supplementary Fig. 25). We noted upon subclustering iPT heterogeneity that corresponded with neighboring cell identity (Extended Data Fig. 9), supporting our Visium data that iPT subpopulations colocalize and may be related to the underlying ME. In the CosMx dataset, APOE, SPP1 and KRT7 (Extended Data Fig. 9b) marked these subclusters. Our identification of these specific markers, as opposed to other iPT markers, may be related to the relative paucity of transcripts used by the CosMx platform compared to whole transcriptome approaches.
In summary, the different types of single-cell omics data indicated a highly plastic PT cell population, including iPT cells. Our SP analysis highlighted different types of iPT cells (VCAM1+ and HAVCR1+). We observed VCAM+ iPT and PEC cells in non-CKD adult kidney samples, while HAVCR1+ cells were enriched in the FME and diseased kidneys.
FME genes predict disease progression
We wanted to understand whether our spRNA-seq can aid disease classification and prognosis evaluation. We first generated an FME gene signature (FME-GS; Supplementary Table 23) and used this signature to analyze based on the spatial single cell gene expression information from a large external kidney cohort containing 292 human kidneys (Fig. 6a), including healthy samples and samples with varying severity of CKD (attributed to diabetes and hypertension). Our FME-GS successfully discriminated samples with more severe disease (higher fibrosis and lower eGFR) from healthier samples (Fig. 6b,c and Supplementary Tables 24 and 25), despite the fact that these parameters were not included in the clustering algorithm.
Fig. 6 |. FME-GS successfully predicts disease prognosis in a large cohort of human kidney samples.
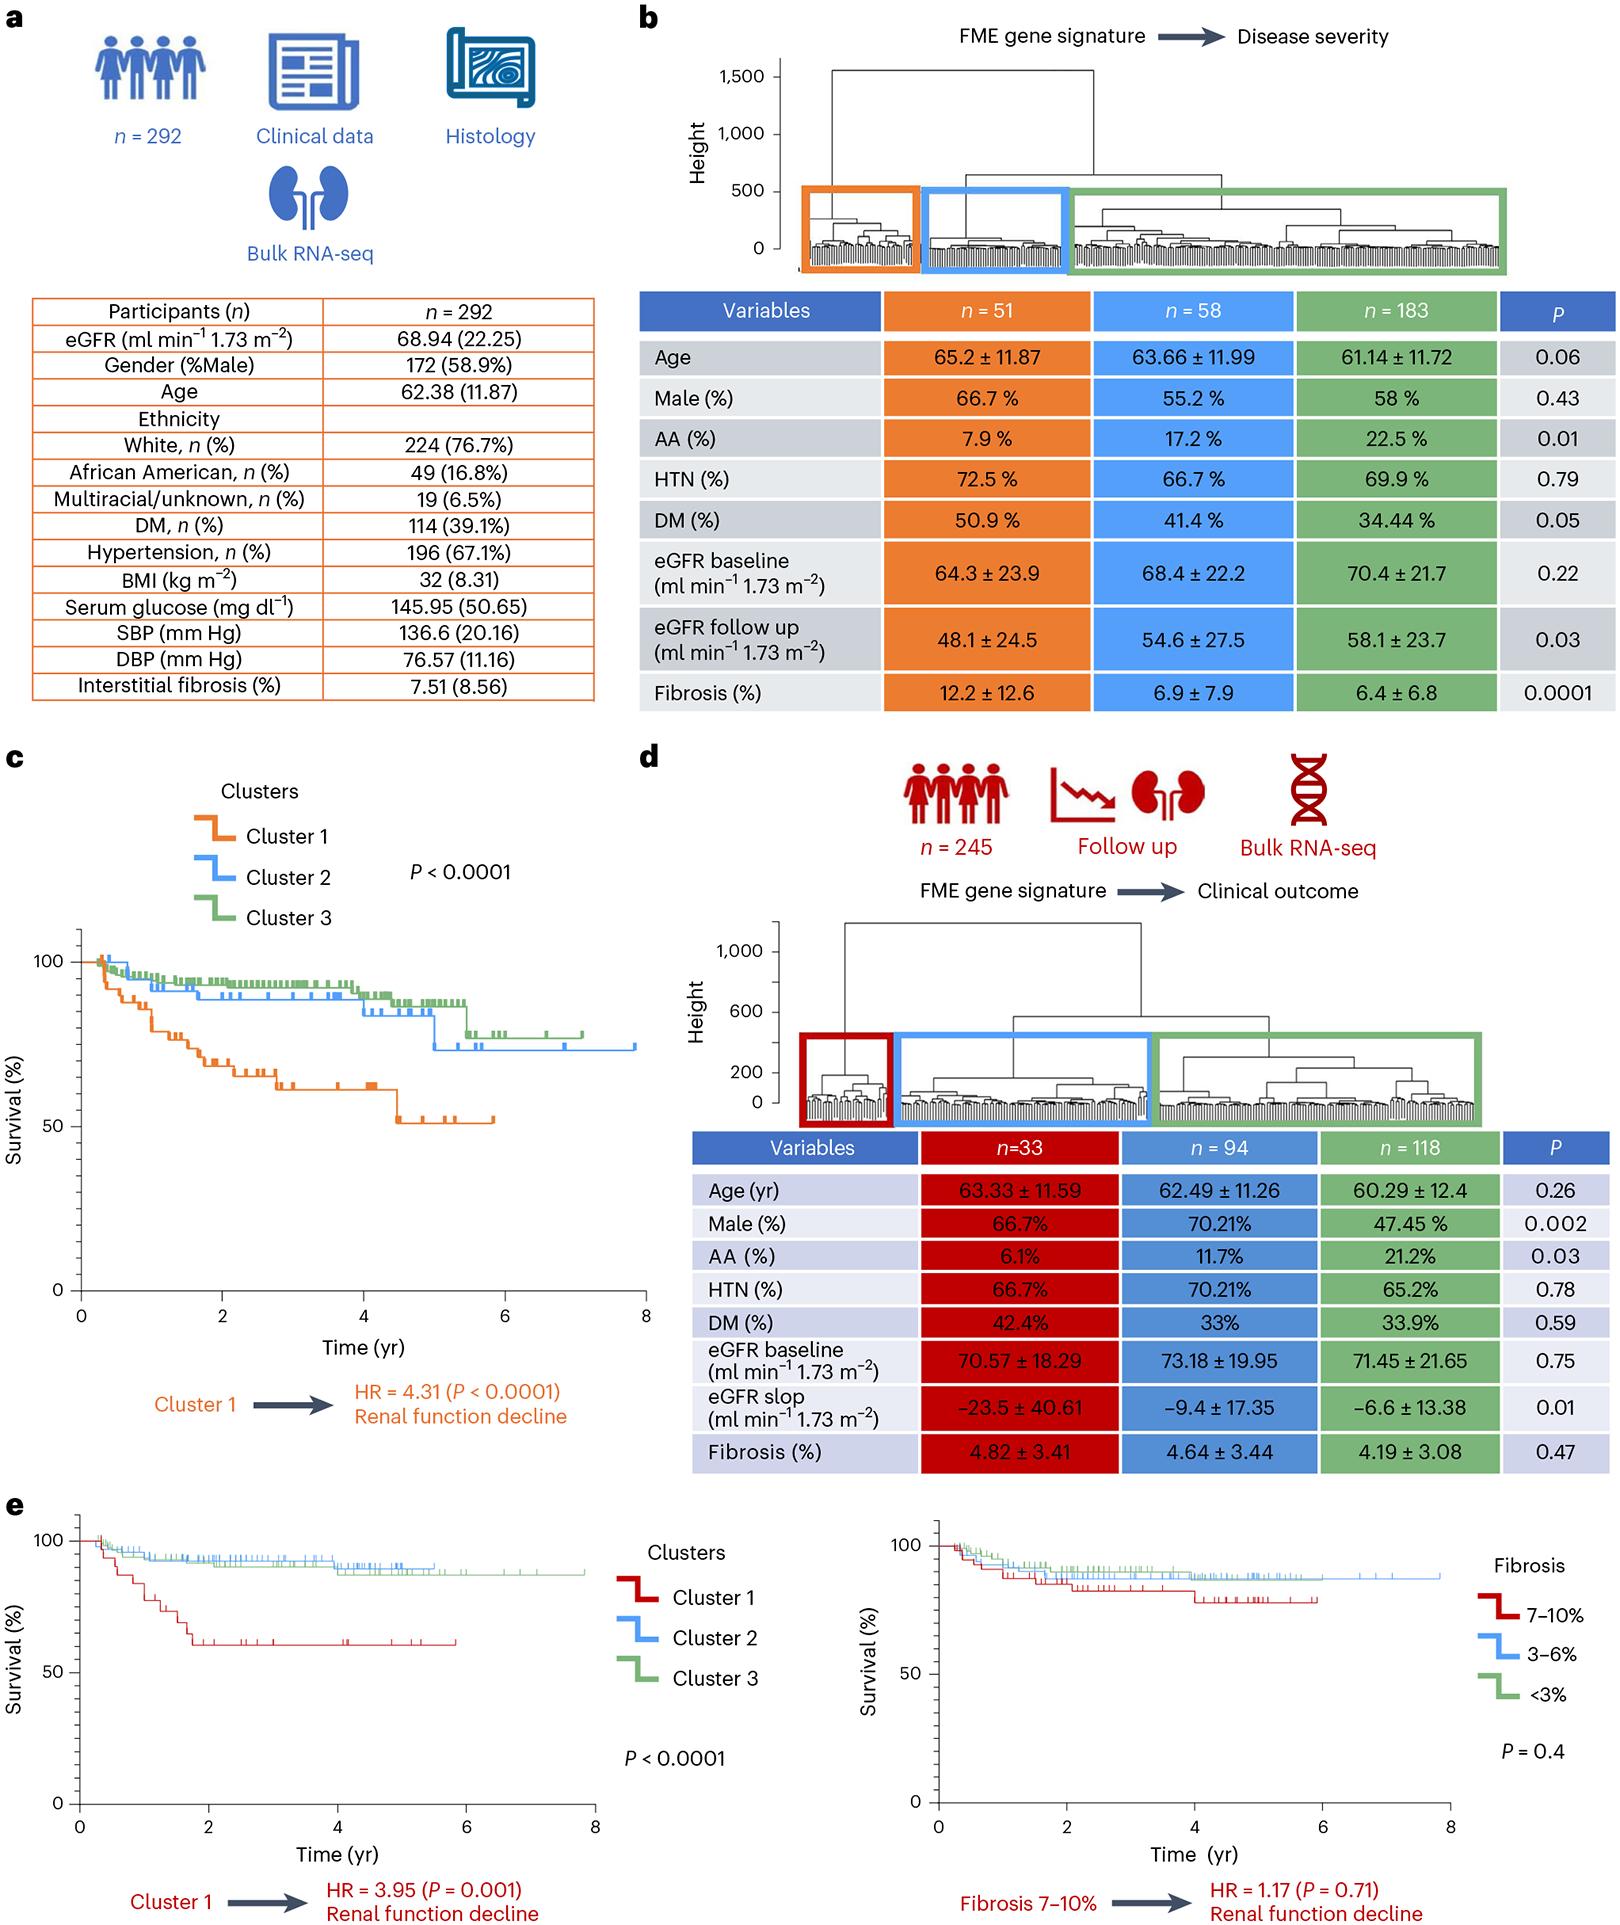
a, Clinical characteristics of 292 human kidney tubule RNA samples. b, Unbiased cluster dendrogram of 292 human kidney tubule bulk RNA-seq samples based on FME-GS. Clinical characteristics of each cluster. Chi-square test for categorical variables and one-way ANOVA for continuous variables were used to compare groups. c, Unbiased cluster dendrogram of 245 human kidney tubule bulk RNA-seq samples with fibrosis <10% based on the expression of FME genes. Clinical characteristics of each cluster are shown in the table. Chi-square test for categorical variables and one-way ANOVA for continuous variables were used to compare groups. Kaplan–Meier analysis of 292 kidney samples based on FME gene signature. d, Unbiased cluster dendrogram of 245 human kidney tubule bulk RNA-seq samples with fibrosis. e, Kaplan–Meier analysis of 245 kidney samples based on FME-GS (left). Kaplan–Meier analysis of 245 kidney samples based on pathologist-defined kidney fibrosis degree (<3%, 3–6% or 7–10% as defined by an expert pathologist) (right). Renal survival was defined as cases reaching end-stage renal disease (eGFR of 15 ml min−1 1.73 m−2) or greater than 40% eGFR decline. The log-rank test was used to determine the P value using the survival R package. HTN, hypertension; DM: diabetes; AA, African American; SBP, systolic blood pressure; DBP, diastolic blood pressure.
Next, we wanted to understand whether the FME signature could predict kidney disease prognosis. We found that cluster 1 subgroup, samples with the highest FME-GS load, had four times higher chance of reaching an endpoint, defined as a 40% change in eGFR or reaching end-stage renal failure (eGFR < 15 ml min−1; Fig. 6c). Subgroup analysis, however, indicated that samples with the highest FME-GS have statistically higher degree of fibrosis 12.1% versus 6.51%. While this difference is small, the differences were statistically significant.
Finally, we wanted to understand whether the FME signature could also predict renal disease progression in patients with preserved eGFR (mean eGFR = 70 ml min−1 1.73 m−2) and minimal observable structural damage (interstitial fibrosis less than 10%). These parameters are used to define the lack of structural and functional kidney damage (CKD/fibrosis)45 (Fig. 6d). The pathologist reported that fibrosis score could not predict the outcome for these samples (hazard ratio (HR) = 1.17, 95% confidence interval (CI): 0.49–2.83; Fig. 6e). Kaplan–Meier analysis indicated that cluster 1, with the highest FME-GS load, had a significantly higher HR to reach the endpoint (HR = 3.95, 95% CI: 1.71–9.12; Fig. 6e). While the entire FME gene set better predicted outcome, using only the top ten genes from the least absolute shrinkage and selection operator (LASSO) regression still showed statistically significant enrichment for renal failure (P = 0.021; Extended Data Fig. 10 and Supplementary Table 26). Clustering samples using a random gene set did not correlate with outcomes (Extended Data Fig. 10). Analyzing the relationship between cell types and kidney disease progression, we found that genes that correlated with eGFR slope were enriched in iPT and stromal cells, potentially implying their causal role (Extended Data Fig. 10).
Discussion
Here we present the spatial molecular principles of kidney health and disease by generating a comprehensive and spatially resolved human kidney atlas and combining single-cell omics data (scRNA-seq, snRNA-seq and snATAC–seq) from a large number of human kidney tissue samples with varying degrees of disease severity. Our work fills a critical knowledge gap by characterizing the gene-expression program of cells previously only defined by their spatial location, showing the anatomical location of cells observed in dissociated single-cell expression data, and defining cell-type-specific gene-expression changes in diseased states. We define the cellular complexity of the FME as the intricate interaction of many different cell types. We furthermore demonstrate the clinical prognostic value of SP, even for samples where the current pathological analysis loses sensitivity.
Previous single-cell analyses, focusing on dissociated human and mouse kidney datasets, have generated gene expression and regulatory matrices for a variety of kidney cell types8–12,46. As kidney cell types have been functionally well characterized, most identified cell types have been matched back to a more than half-century-old functional cell-type definition6. A key limitation of these analyses has been the identification and molecular characterization of anatomically defined cell types, such as mesangial cells, PECs and fibroblasts. Here we demonstrate that a joint approach, which combines single-cell and single-nuclear expression, open chromatin and single-cell and spot-level spRNA-seq data from many diverse samples and a large number of cells, is critical to achieving this goal. Orthogonal analytical tools provide unique opportunities for validation, as each method suffers from specific technological biases. Here we have not only been able to resolve and validate previously anatomically known cell types but also identify cell types such as specific stromal cells for glomerulosclerosis (expressing CDH13)47. Furthermore, we clarify genes expressed by cells previously only identified by their anatomical location, such as PECs.
Fibrotic diseases are responsible for close to 40% of all deaths48. Kidney fibrosis is the final common pathway to end-stage kidney failure49. Using our datasets, we characterize stromal cell subtypes, and we validate their consistency with other studies. We could conclusively discriminate VSMC and mesangial cells from myofibroblasts. They are anatomically distinct but share gene-expression signatures in dissociated scRNA/snRNA-seq data50–52. We could identify markers of stromal cell types and determine their spatial location. This information could be important for finding therapeutic candidates for renal fibrosis. We noted a cluster of FAP+ fibroblasts in diseased human kidneys53–55. FAP-targeted cellular and RNA therapies have been developed and shown to have efficacy in animal models of cardiac fibrosis53–55. Our data suggest that these therapeutics may be helpful for treating kidney fibrosis.
Here we demonstrate the cellular and architectural complexity of kidney fibrosis. We propose the use of the FME to characterize these lesions, to not only focus on matrix accumulation but also on the elaborate cellular complexity of these lesions. We show that the FME signature contains tubule cells including iPT. While iPT cells have been observed in dissociated single-cell data, here we show that these cells can be consistently identified in all datasets and contain consistent markers. We furthermore identify spatially defined iPT subtypes10. We show that in humans, VCAM1+ cells can be observed in participants with preserved kidney function. Furthermore, this might be consistent with our observations that some PECs express VCAM1. It could also be explained by the fact that a low degree of fibrosis is observed in some healthy participants or during aging. We identify HAVCR1+ iPT cells, a population that was enriched in diseased samples relative to healthy samples in our dissociated and Visium spatial data. HAVCR1 has been identified as a marker of acute and CKD56.
One of the most devastating complications of CKD is its progression to ESRD, which requires life-sustaining dialysis or transplantation57. Predicting disease progression is of major clinical importance. This has been classically done using eGFR. While some studies indicated that including the degree of tissue fibrosis can improve kidney prognosis estimates, this has not been uniformly observed. By using the single cell gene expression data derived FME-GS score, we were able to improve upon this. We identified participants at risk of ESRD in a large external dataset of human kidney tissue samples, where traditional fibrosis scores had limited predictive value. These results establish FME-GS as a key biomarker and potential causal pathway of progression. Future studies should work on optimizing and validating the predictive gene signature, but our preliminary data indicate that a relatively small number of genes may help identify which patients will progress to renal failure.
Our study has limitations. We present the initial interpretation of one of the largest dissociated and spatially resolved human kidney datasets. We used the clinical and histological annotation for disease definition; however, hypertensive kidney disease might not be a single disease entity. Hypertension might not be the single cause of injury for patients with this diagnosis. While we applied a variety of tools and methods, future studies will be essential for a more comprehensive analysis of the presented information. Our datasets indicate the presence and key role of injured PT cells and immune cells in disease progression; however, their functional role should be studied in mechanistic experiments using cells and animal models. Furthermore, the FME-GS and its predictive value needs to be validated in other cohorts.
In summary, we develop a spatially defined molecular human kidney cellular atlas, characterize the FME and indicate its role as a clinically meaningful prognostic disease biomarker, demonstrating the use of spRNA-seq for the investigation of complex diseases.
Online content
Any methods, additional references, Nature Portfolio reporting summaries, source data, extended data, supplementary information, acknowledgements, peer review information; details of author contributions and competing interests; and statements of data and code availability are available at https://doi.org/10.1038/s41588-024-01802-x.
Methods
snRNA-seq
Nuclei were isolated using lysis buffer (Tris–HCl, NaCl, MgCl2, NP40 10% and RNAse inhibitor (40 U μl−1)). In total, 10–30 mg of frozen kidney tissue was minced with a razor blade into 1–2 mm pieces in 1 ml of lysis buffer. The chopped tissue was transferred into a gentleMACS C tube and homogenized in 2 ml of lysis buffer using a gentleMACS homogenizer with programs of Multi_E_01 and Multi_E_02 for 45 s. The homogenized tissue was filtered through a 40 μm strainer (Thermo Fisher Scientific, 08–771-1), and the strainer was washed with 4 ml wash buffer. Nuclei were centrifuged at 500g for 5 min at 4 °C. The pellet was resuspended in wash buffer (PBS 1× + BSA 10% (50 mg ml−1) + RNAse inhibitor (40 U μl−1)) and filtered through a 40 μm Flowmi cell strainer (Sigma-Aldrich, BAH136800040–50EA). Nuclear quality was checked, and nuclei were counted. In accordance with the manufacturer’s instructions, 30,000 cells were loaded into the Chromium Controller (10X Genomics, PN-120223) on a Chromium Next GEM Chip G Single Cell Kit (10X Genomics, PN-1000120) to generate single-cell GEM (10X Genomics, PN-1000121). The Chromium Next GEM Single Cell 3′ GEM Kit v3.1 (10X Genomics, PN-1000121) and Single Index Kit T Set A (10X Genomics, PN-120262) were used in accordance with the manufacturer’s instructions to create the cDNA and library. Libraries were subjected to quality control using the Agilent Bioanalyzer High Sensitivity DNA Kit (Agilent Technologies, 5067–4626). Libraries were sequenced using the NovaSeq 6000 system (Illumina) with 2 × 150 paired-end kits. Demultiplexing was as follows: 28 bp Read1 for cell barcode and UMI, 8 bp I7 index for sample index and 91 bp Read2 for transcript.
snATAC–seq
The procedure described above for snRNA-seq was used to isolate the nuclei for ATAC–seq. The resuspension was performed in diluted nuclei buffer (10× Genomics). Nuclei quality and concentration were measured in the Countess AutoCounter (Invitrogen, C10227). Diluted nuclei were loaded and incubated in chromium single-cell ATAC Library and Gel Bead Kit’s transposition mix (10X Genomics, PN-1000110). Chromium Chip E (10X Genomics, PN-1000082) in the chromium controller was used to capture the gel beads in the emulsions (GEMs). The Chromium Single Cell ATAC Library & Gel Bead Kit and Chromium i7 Multiplex Kit N Set A (10X Genomics, PN-1000084) were then used to create snATAC libraries in accordance with the manufacturer’s instructions. Library quality was examined using an Agilent Bioanalyzer High Sensitivity DNA Kit. After sequencing on an Illumina Novaseq system using two 50 bp paired-end kits, libraries were demultiplexed as follows: 50 bp Read1 for DNA fragments, 8 bp i7 index for sample index, 16 bp i5 index for cell barcodes and 50 bp Read2 for DNA fragments.
scRNA-seq
Fresh human kidneys (0.5 g) collected in RPMI media were minced into approximately 2–4 mm cubes using a razor blade. The minced tissue was then transferred to a gentleMACS C tube containing Multi Tissue Dissociation Kit 1 (Miltenyi Biotec, 130–110-201). The tissue was homogenized using the Multi_B program of the gentleMACS dissociator. The tube, containing 100 μl of enzyme D, 50 μl of enzyme R and 12.5 μl of enzyme A in 2.35 ml of RPMI, was incubated for 30 min at 37 °C. Second homogenization was performed using the Multi_B program on the gentleMACS dissociator. The solution was then passed through a 70-μm cell strainer. After centrifugation at 600g for 7 min, the cell pellet was incubated with 1 ml of RBC lysis buffer on ice for 3 min. The reaction was stopped by adding 10 ml of PBS. Next, the solution was centrifuged at 500g for 5 min. Finally, after removing the supernatant, the pellet was resuspended in PBS. Cell number and viability were analyzed using Countess AutoCounter (Invitrogen, C10227). This method generated a single-cell suspension with greater than 80% viability. Next, 30,000 cells were loaded into the Chromium Controller (10X Genomics, PN-120223) on a Chromium Next GEM Chip G Single-Cell Kit (10X Genomics, PN-1000120) to generate single-cell GEM according to the manufacturer’s protocol (10X Genomics, PN-1000121). The cDNA and library were made using the Chromium Next GEM Single Cell 3′ GEM Kit v3.1 (10X Genomics, PN-1000121) and Single Index Kit T Set A (10X Genomics, PN-120262) according to the manufacturer’s protocol. Quality control for the libraries was performed using the Agilent Bioanalyzer High Sensitivity DNA Kit (Agilent Technologies, 5067–4626). Libraries were sequenced on the NovaSeq 6000 system (Illumina) with 2 × 150 paired-end kits using the following demultiplexing: 28 bp Read1 for cell barcode and unique molecular identifier (UMI), 8 bp I7 index for sample index and 91 bp Read2 for transcript.
Visium FFPE sample preparation
The RNA quality of the human kidney FFPE sample was checked by the RNeasy FFPE Kit (Qiagen, 73504) according to the manufacturer’s protocol. RNA quality was examined using an Agilent bioanalyzer, and samples with DV200 > 50% were selected. Then a 5 μm tissue sample was cut onto the 10× Visium Spatial Gene Expression Slide. After deparaffinization, hematoxylin and eosin (H&E) staining was performed. We used Keyence 1266 BZ-X810 microscope for whole-slide imaging. After scanning, de-cross-linking, probe hybridization, probe release and extension, library preparation was performed using a Single Index Kit TS Set A (10X Genomics, PN-3000511) according to the manufacturer’s protocol. Quality control for the libraries was performed using the Agilent Bioanalyzer High Sensitivity DNA Kit (Agilent Technologies, 5067–4626). Libraries were sequenced using the NovaSeq 6000 system (Illumina) with 2 × 150 paired-end kits. Demultiplexing was as follows: 28 bp Read1 for cell barcode and UMI, 10 bp I7 index, 10 bp i5 index and 50 bp Read2 for transcript.
CosMx sample preparation
Samples were prepared according to manufacturer specifications. Tissue sections were cut at 5 μm thickness and prepared according to the manufacturer’s specifications (NanoString Technologies). We used the human universal cell characterization RNA probes, plus 50 additional custom probes that were designed to the following gene transcripts: ESRRB, SLC12A1, UMOD, CD247, SLC8A1, SNTG1, SLC12A3, TRPM6, ACSL4, SCN2A, SATB2, STOX2, EMCN, MEIS2, SEMA3A, PLVAP, NEGR1, SERPINE1, CSMD1, SLC26A7, SLC22A7, SLC4A9, SLC26A4, CREB5, HAVCR1, REN, AP1S3, LAMA3, NOS1, PAPPA2, SYNPO2, RET, LHX1, SIX2, CITED1, WNT9B, AQP2, SCNN1G, ALDH1A2, CFH, NTRK3, WT1, NPHS2, PTPRQ, CUBN, LRP2, SLC13A3, ACSM2B, SLC4A4, PARD3, XIST and UTY. Samples were imaged with configuration A. After imaging, the flowcell was kept in xylene overnight, the coverslip was removed and the slide was stained with H&E.
Human sample acquisition
The University of Pennsylvania institutional review board (IRB) approved the collection of human kidney tissue for this study. Left-over kidney samples were irreversibly de-identified, and no personal identifiers were gathered. Therefore, they were exempt from IRB review (category 4). We engaged an external, honest broker who was responsible for clinical data collection without disclosing personally identifiable information. Participants were not compensated.
Cortical and outer medullary areas of the human kidney were used for scRNA-seq, snRNA-seq and snATAC–seq. In addition, a portion of the tissue was FFPE and stored for SP, as well as stained with periodic acid–Schiff for pathology scoring. A local renal pathologist performed objective pathological scoring.
Immunostaining.
Paraffin blocks were sectioned and deparaffinized. For blocking, 1% BSA was used. Slides were then incubated overnight with diluted primary antibodies (CD4 (cell signaling technologies, 48274), IGKC from (BioLegend, 392702) and CD79A (Abcam, ab79414)). After washing the sections with PBS three times, secondary antibodies were applied for 1 h at room temperature (goat anti-rabbit Alexa Fluor 555 (Invitrogen, A327272) and goat anti-mouse Alexa Fluor 488 (Invitrogen, A21202)). After DAPI staining, slides were imaged with an OLYMPUS BX43 microscope. Positive cells in ten randomly selected fields were counted on each slide.
Imaging mass spectrometry.
Formalin-fixed paraffin-embedded (FFPE) tissue sections were deparaffinized and rehydrated using standard protocols. Antigen retrieval was performed using citrate buffer (pH 6.0), and sections were blocked with a buffer containing 5% BSA. Primary antibodies against target proteins were conjugated with Cd metal isotopes using the Maxpar Antibody Labeling Kit (Fluidigm). Tissue sections were incubated with the antibody–metal conjugates overnight at 4 °C. After washing, secondary antibodies, conjugated with a different Cd metal isotope, were added to amplify the signal. Finally, the tissue sections were stained with an iridium intercalator for nuclear staining. IMC imaging was performed using a Hyperion Imaging System (Fluidigm) equipped with a ×20 objective lens. The tissue sections were ablated using a laser at a 1 μm pixel size, and the resulting metal signals were detected by a time-of-flight mass spectrometer.
Kaplan–Meier and Cox-regression analysis.
To compare the probability of reaching the outcome of end-stage kidney disease (eGFR < 15 ml min−1 1.73 m−2) or 40% eGFR decline, Kaplan–Meier life table survival analysis was performed. The log-rank test was used to compare the survival probability in different clusters using the survival R package. Cox proportional HR analysis was applied to estimate the HR of the outcomes of the participants in different groups.
Linear regression analysis.
To perform the linear regression analysis between fibrosis, eGFR or eGFR decline with gene-expression levels in each cell type, cells were subset based on the frequency of each cell type with a maximum number of 1,000 cells proportional to its original fraction. A regression model adjusted for age, sex, ethnicity, diabetes mellitus, hypertension and quality control (QC) parameters (nFeature_Count, nCount_RNA and percent_mt) was used. False discovery rate (FDR) < 0.05 was considered as significant threshold.
Statistics and reproducibility
Data were expressed as means ± s.e.m. Independent sample t test was used to compare the continuous variable in two groups, and one-way analysis of variance (ANOVA) was used to compare continuous parameters between more than two groups followed by the Bonferroni post hoc test for subgroup comparisons. A P < 0.05 was considered as significant. LASSO regression was performed with scikit-learn’s (v1.3) LASSO CV function; 10 n_splits with three repeats were used for parameter tuning.
For comparisons within our single-cell data, we treat each cell as an independent observation, after merging samples.
For our spatial data, we performed analysis on 2 CosMx samples and 14 Visium samples. Representative plots of tissue location are shown here, although full tissue plots are shown in Extended Data Fig. 5 and Supplemental Figs. 6 and 13.
Bioinformatic analysis
Bioinformatic analysis is discussed in Supplementary Information.
Reporting summary
Further information on research design is available in the Nature Portfolio Reporting Summary linked to this article.
Extended Data
Extended Data Fig. 1 |. Multimodal single-cell atlas.
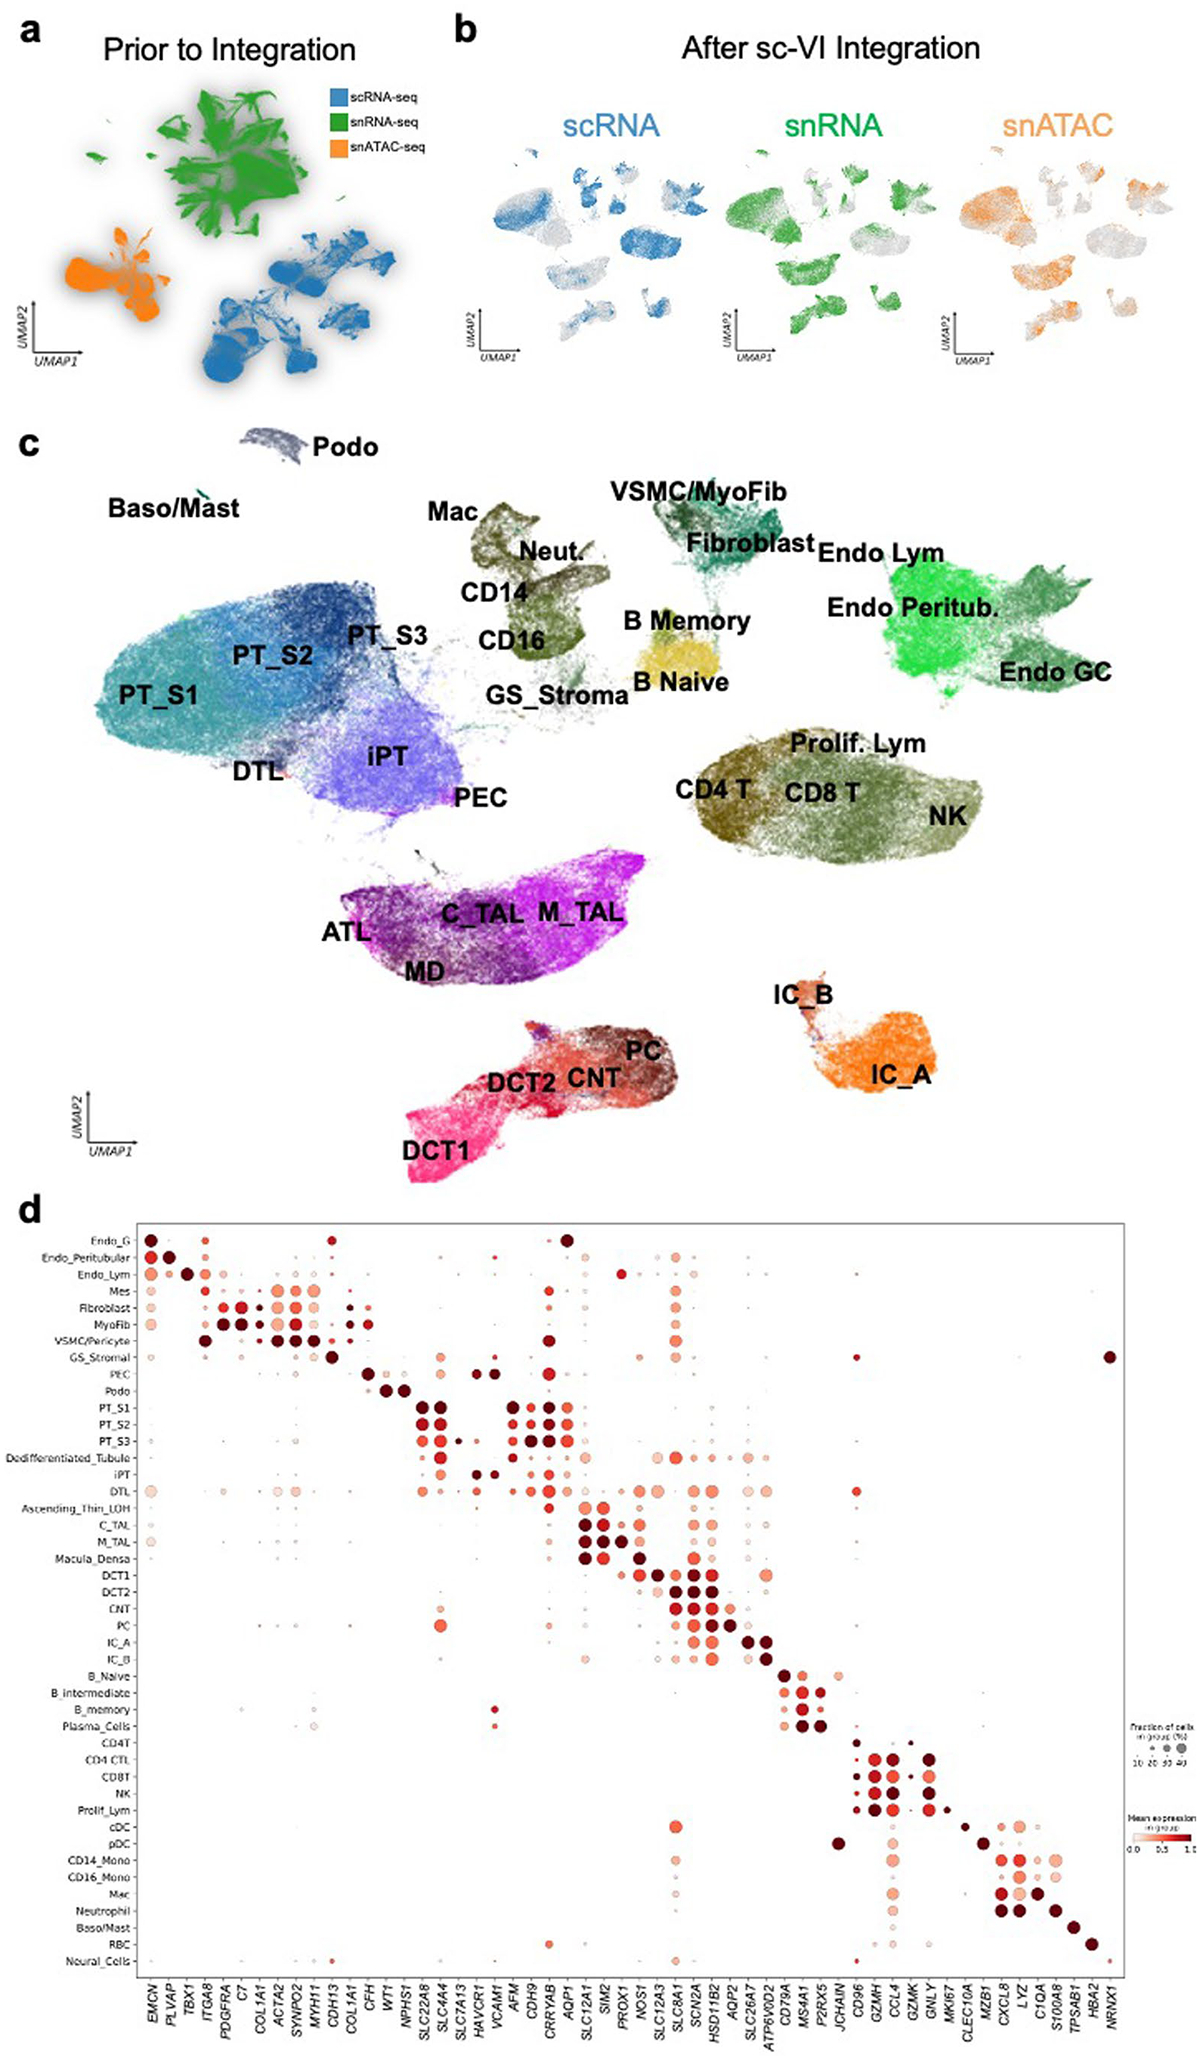
(a) UMAP of snRNA-seq, scRNA-seq and snATAC-seq datasets before integration. (b) UMAP of integrated snRNA-seq, scRNA-seq and snATAC-seq datasets of 338,565 cells and nuclei using the SCVI tool. (c) Annotations of cell types on integrated UMAP. (d) The dot plots of marker genes used to annotate 44 main cell types in the integrated dataset. The size of the dot indicates the percent of positive cells, and the darkness of the color indicates average expression.
Extended Data Fig. 2 |. Integrations of snRNA-seq, scRNA-seq and snATAC-seq datasets from multiple sources.

(a) UMAP of integrated snRNA-seq, scRNA-seq and snATAC-seq datasets (n = 588,425 cells and nuclei) from Susztak Lab and KPMP using the SCVI tool. Left, the new annotation after integration of the dataset. Right, the original annotation used by KPMP. (b) Bar charts showing cell abundance in each cell cluster (Method, Lab, present study annotation and KPMP annotation).
Extended Data Fig. 3 |. CosMx cell populations.
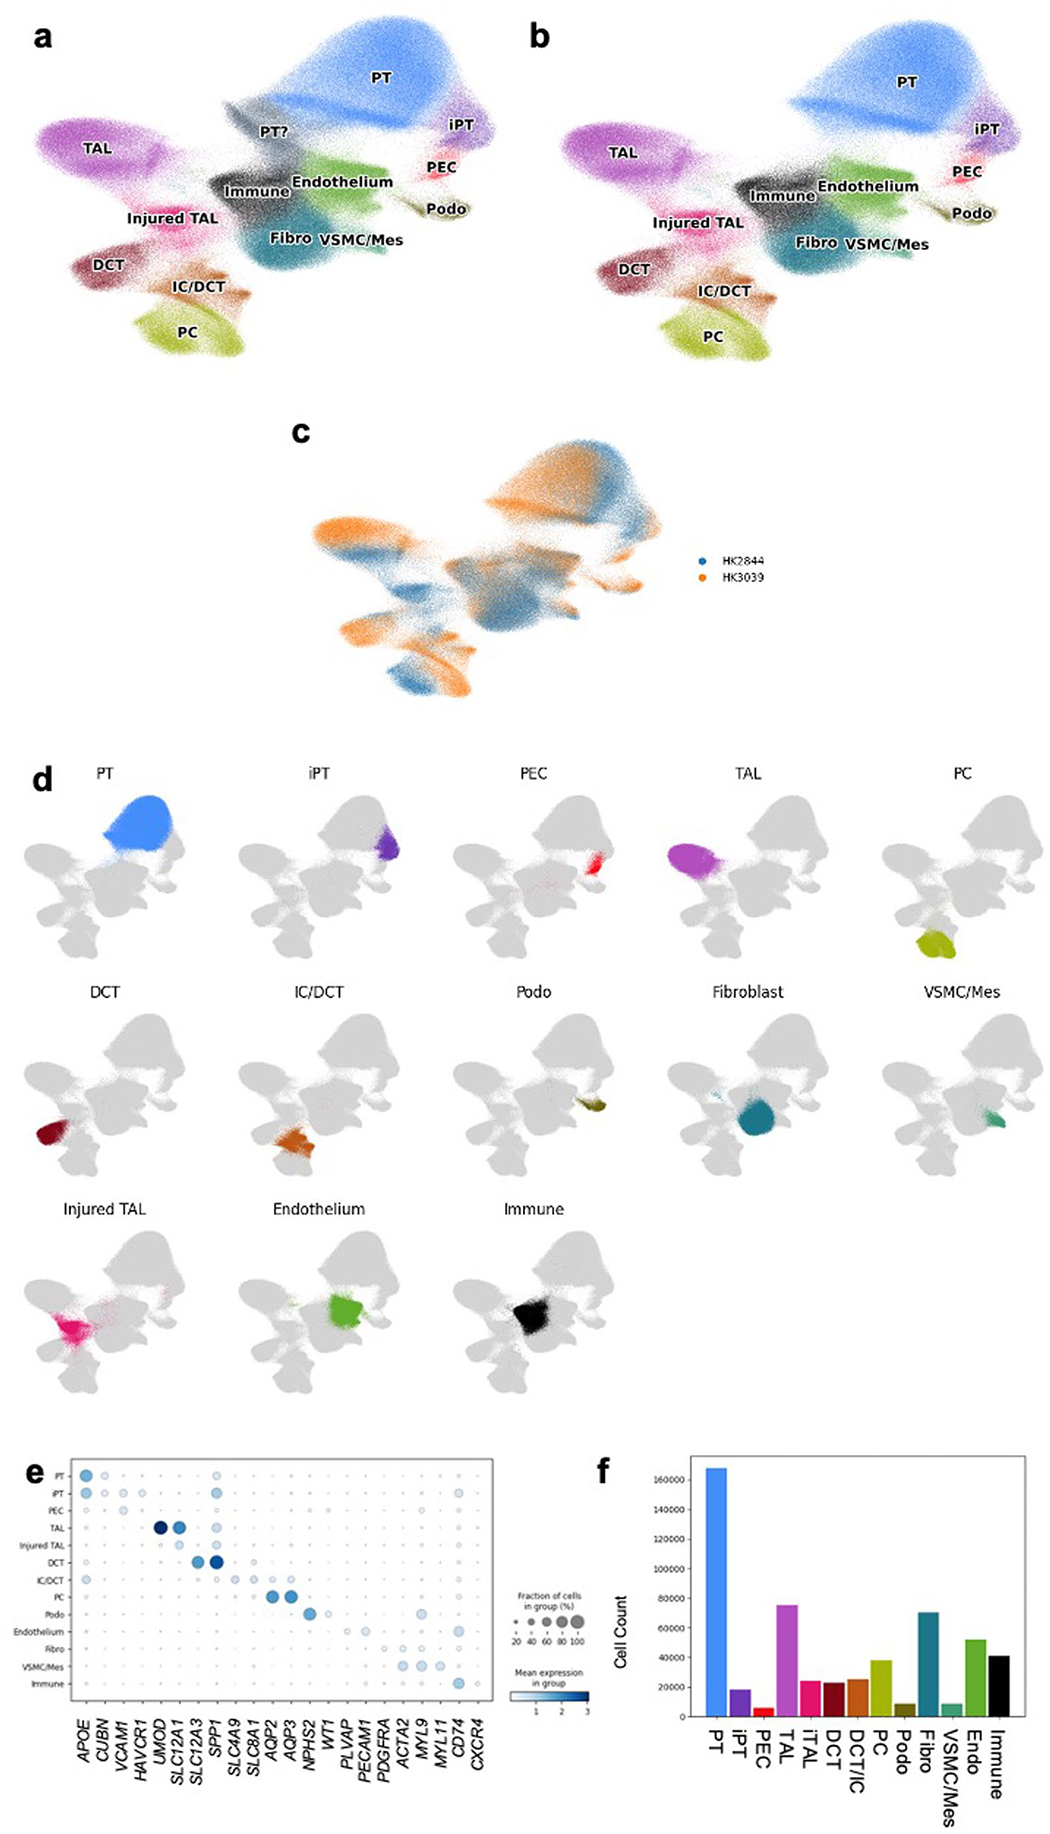
(a) Original UMAP of all cells that passed QC along with their annotations. (b) Cell populations with annotatable markers of the CosMx data on UMAP. (c) UMAP of all CosMx cells by sample. (d) CosMx cell annotations across the UMAP with a single population being shown for a given UMAP demonstrating that these clusters are indeed relatively localized within the UMAP. (e) Dot plot showing markers for each annotated CosMx population. (f) Annotation frequency for each cell type.
Extended Data Fig. 4 |. CosMx SCVI integration with snRNA-seq data.
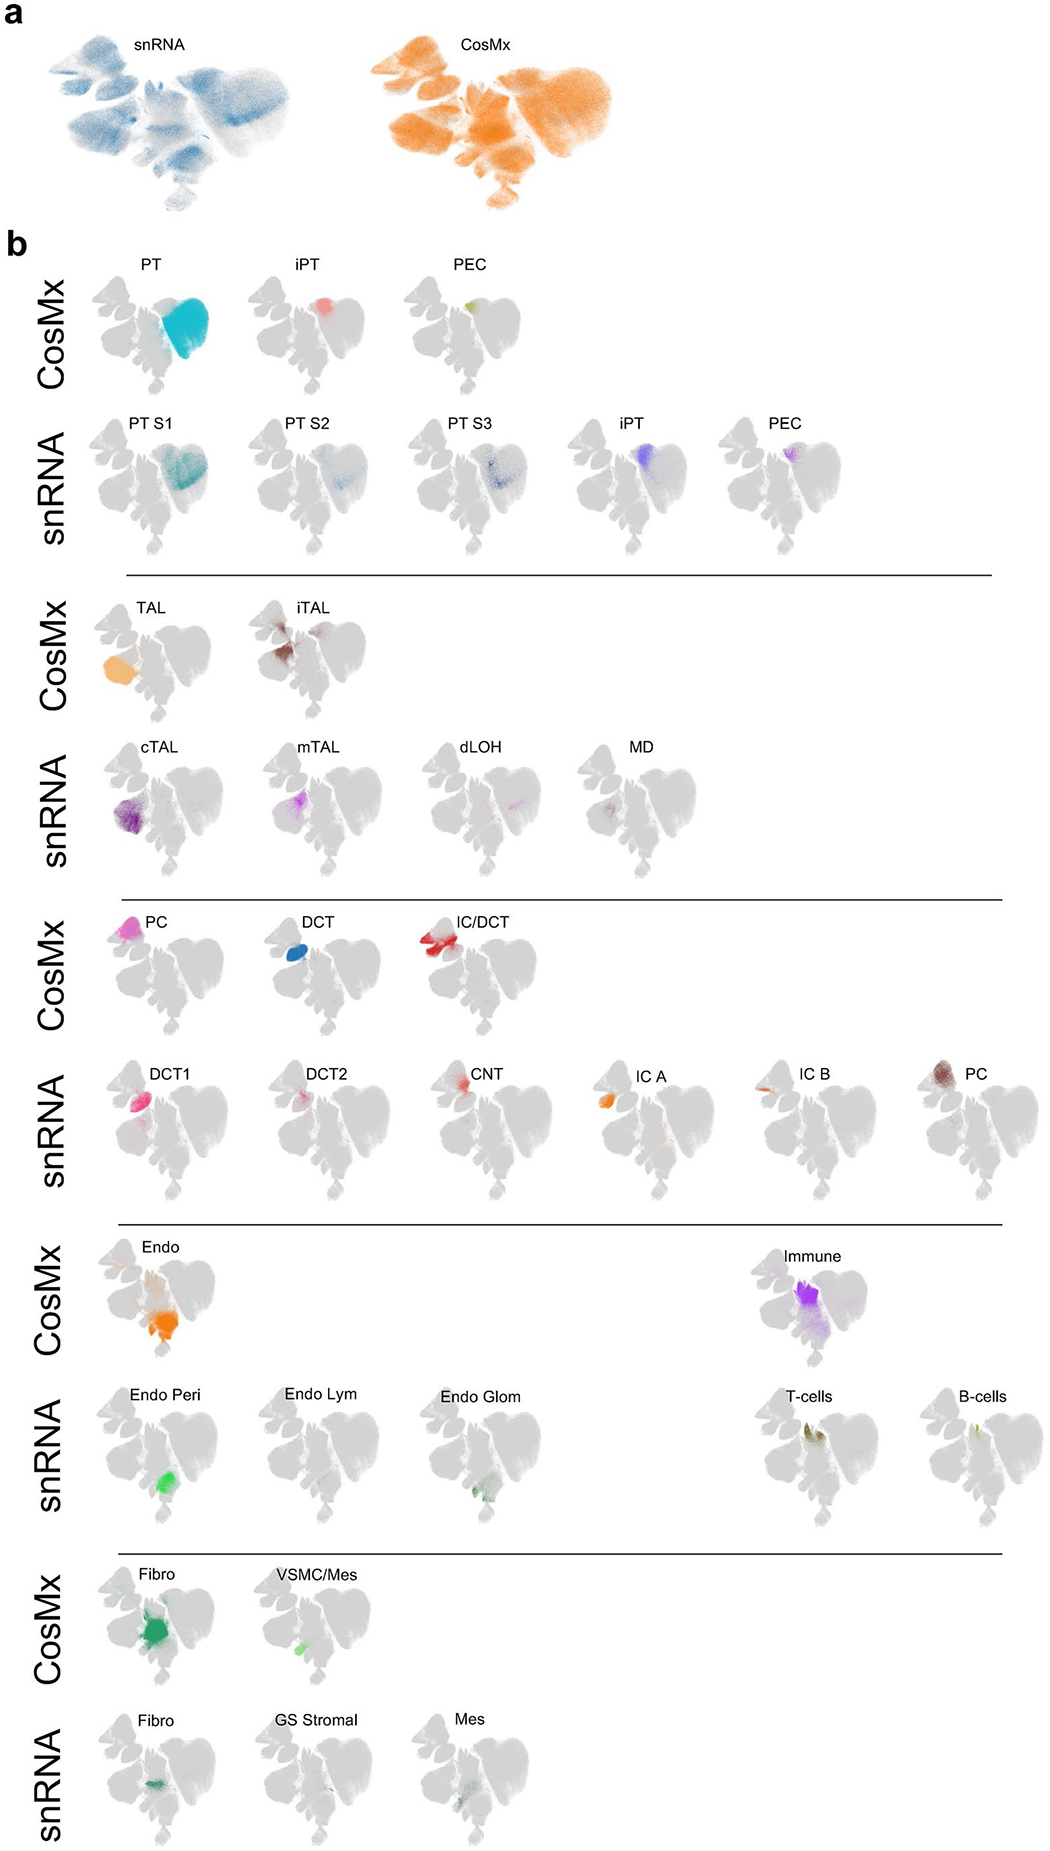
After integrating with the snRNA-seq data, we compared annotations from our CosMx analysis and the original snRNA-seq annotation. (a) UMAP of integrated data demonstrating the technology type of each cell within the UMAP. (b) Comparison of CosMx annotations and snRNA-seq annotations, demonstrating concordance of location within the integrated UMAP.
Extended Data Fig. 5 |. Location of CosMx annotated cell types within the slide.

(a) Location of annotated cell types within the two tissue sections. (b) Location of glomerular cell subtypes. (c) Location of iPT, fibroblasts and immune cells.
Extended Data Fig. 6 |. Microanatomy of the CosMx slide.

(a) Location of glomerular cell types within a subsection of tissue and in a single field of view (right). (b) Location of injured thick ascending limb, healthy injured thick ascending limb, principal cells and immune cell types within a subsection of tissue and in a single field of view (right). (c) Location of distal nephron cell subtypes within a subsection of tissue and in a single field of view (right). (d) Single field of view showing many cell types.
Extended Data Fig. 7 |. Neighborhood characteristics of CosMx slide.
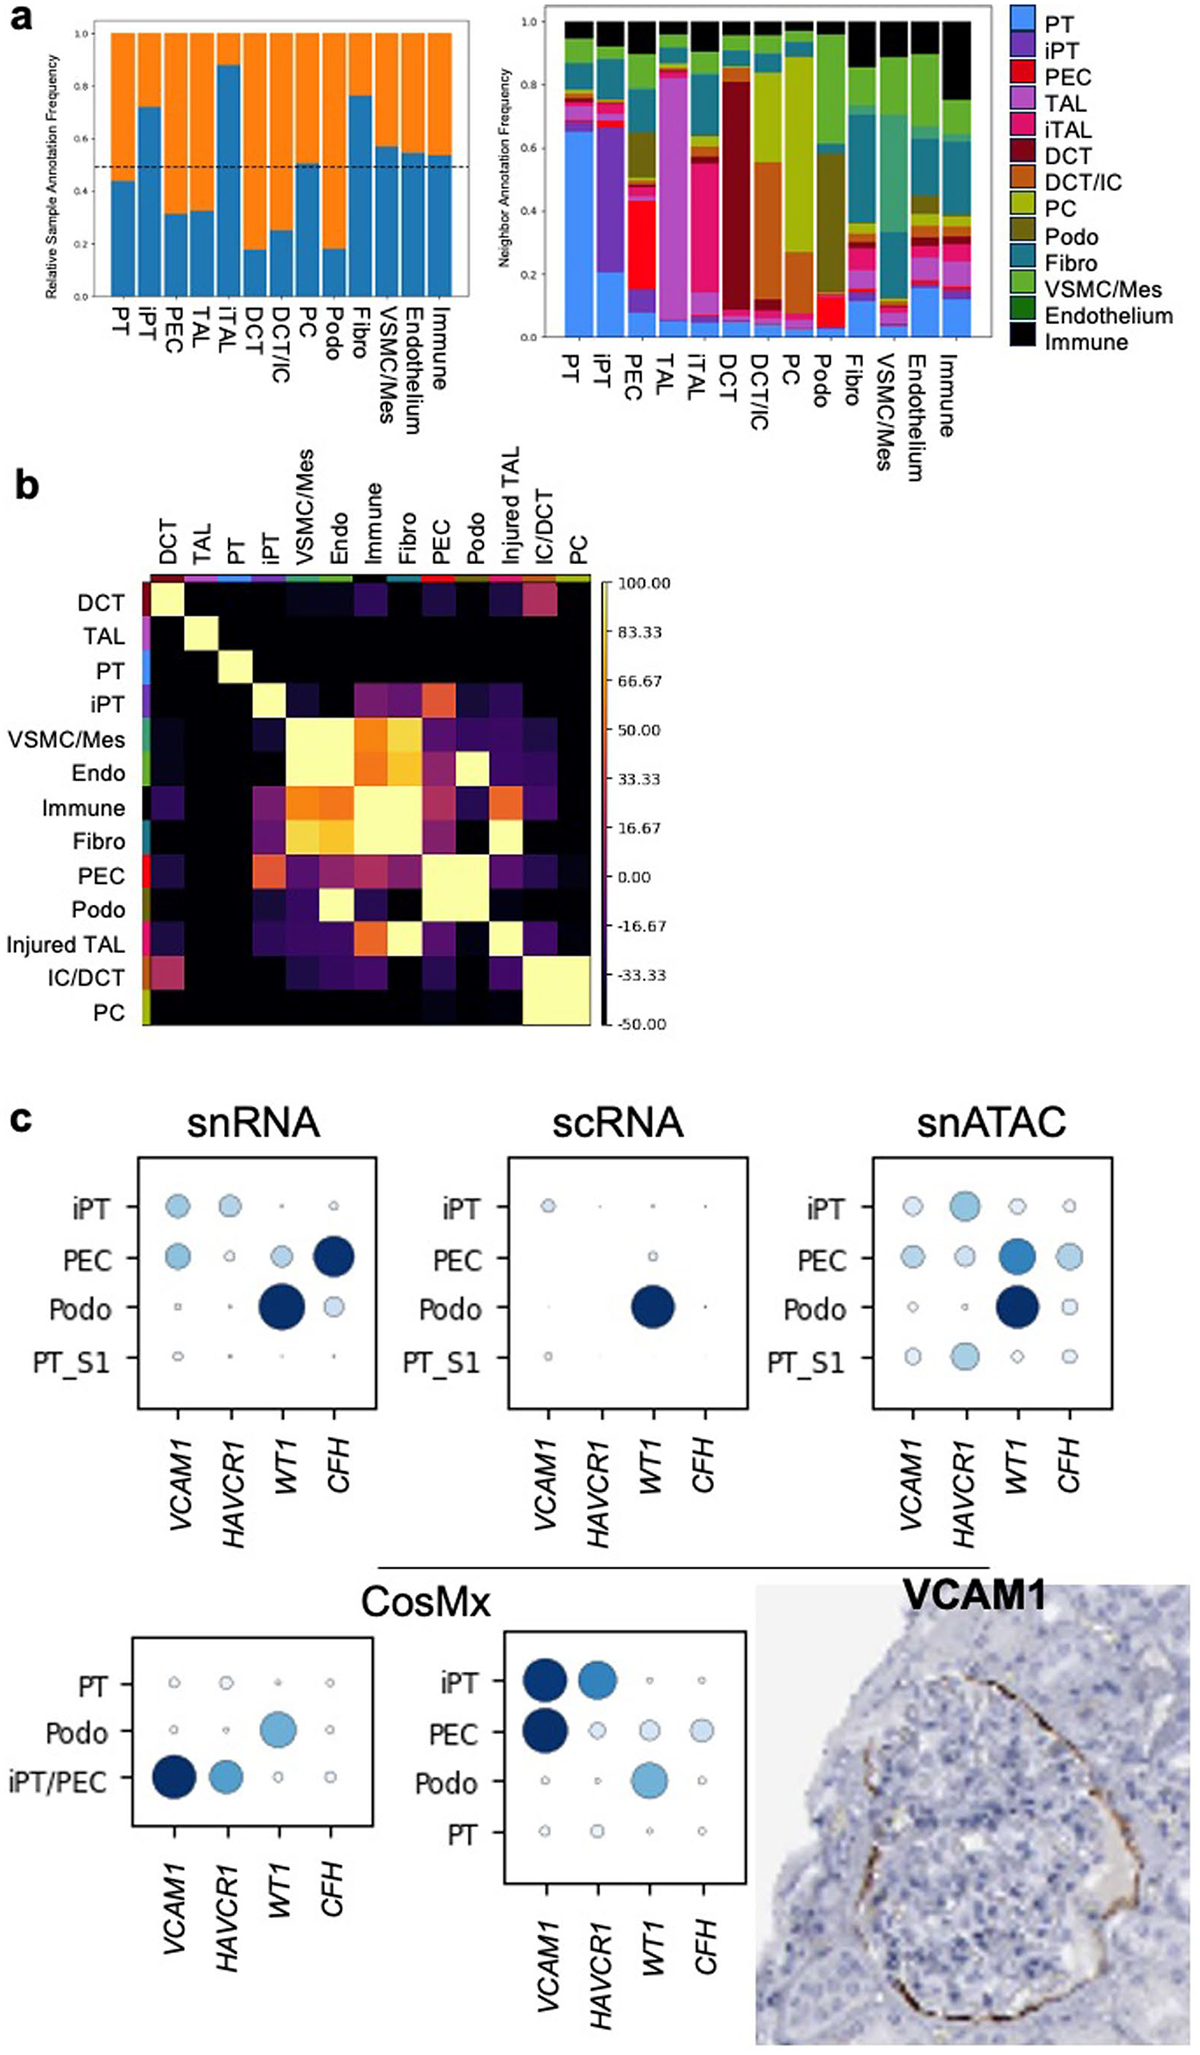
(a) Relative type cell frequency between each sample. Orange indicates HK3039 (healthy), and blue indicates HK2844 (diseased). Right, frequency of neighbor annotations for each cell type for a 20-micron neighborhood. (b) Neighborhood enrichment by permuting annotations for the 20-micron neighborhood size. Lighter color indicates higher enrichment and colocalization of a given population. (c) Dot plots for iPT, PEC, podocytes and PT cells expression of iPT and PEC markers across genomics modalities and protein staining of VCAM1 in PECs from the Human Protein Atlas: https://www.proteinatlas.org/.
Extended Data Fig. 8 |. Cell–cell interaction analysis in the spRNA-seq dataset in fibrotic microenvironment.
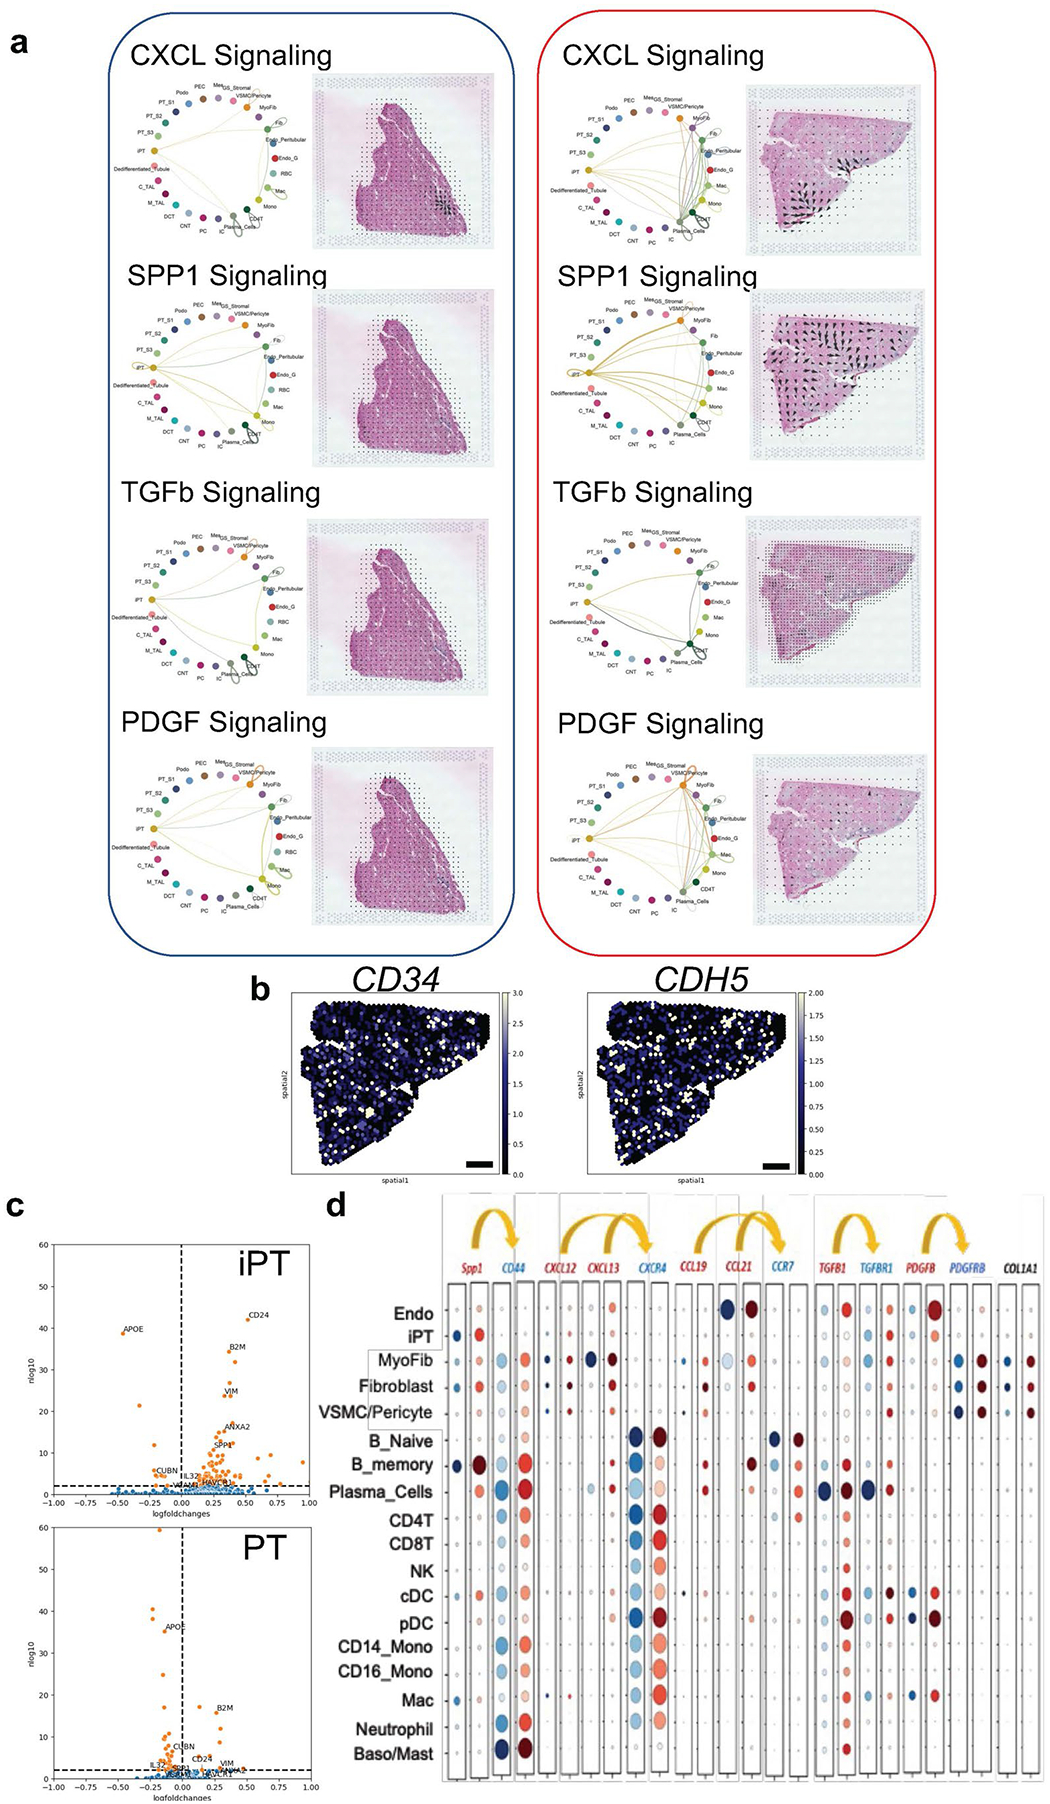
(a) Weighted total interaction strength of the CXCL, SPP1, TGFβ and PDGF pathways in control and diseased samples in the fibrotic microenvironment (left). The spatial location of the identified cell–cell communications pathways (CXCL, SPP1, TGFβ and PDGF) in control and diseased sample in the fibrotic microenvironment (right). The arrows indicate the source and targets of the identified pathways. (b) Expression of CD34 and CDH5 as the markers of high endothelial venules (HEVs) in the fibrotic microenvironments. Scale bar is 1 mm in length. (c) Volcano plot of differentially expressed genes from CosMx data. Cells with an immune neighbor within 20 microns were compared against cells without an immune neighbor for both the PT and iPT population. log(fold change) >0 indicates increased expression in cells with an immune neighbor, while log(fold change) <0 indicates increased expression in cells without an immune neighbor. log10(p value) is indicated by the y axis. Genes with an adjusted p-value < 0.01 are marked in orange. (d) The dot plot of expression of ligands and receptors in regions of FME in integrated snRNA-seq/scRNA-seq and snATAC-seq data. The size of the dot indicates the percent positive cells and the darkness of the color indicates average expression (right). The gray indicates control, and the red indicates diseased group.
Extended Data Fig. 9 |. Spatial characteristics of injured PT subclusters on CosMx.

(a) The CosMx iPT population for each sample was subclustered using a Leiden algorithm with a resolution of 0.3. (b) The top 10 differentially expressed genes for each subcluster. (c) iPT subcluster localization within the entire slide. Views of specific regions indicated by inset boxes are shown in Supplementary Fig. 9d. (d) iPT subclusters visualized on H&E. Subset images showing populations on H&E. Blue cells correspond with cluster 0 (iPT_APOE), orange with cluster 1 (iPT_SPP1) and green with cluster 2 (iPT_KRT7). (e) Frequency of immune and fibroblast neighbors for each iPT subtype within each sample within 20 microns is shown below. We performed testing using a Wilcoxon rank-sum test between each population within a sample. These subtypes had significantly different immune neighbors and fibroblast neighbors with each sample. HK3039 fibroblasts: iPT_APOE vs iPT_SPP1, p-value = 7E-39. HK3039 immune cells: iPT_APOE vs iPT_SPP1, p-value = 4E-67. HK2844 fibroblasts iPT_APOE vs iPT_SPP1, p-value = 9E-9, iPT_KRT7 vs iPT_SPP1, p-value = 9E-46. HK2844 immune cells iPT_APOE vs iPT_SPP1, p-value = 3E-16, iPT_KRT7 vs iPT_SPP1, p-value = 9E-11. (f) iPT subcluster neighborhood enrichment within a 20-micron neighborhood size. Lighter color indicates higher enrichment and colocalization of a given population.
Extended Data Fig. 10 |. FME gene expression predicts kidney outcomes.

(a) Hierarchical clustering of 245 human kidney tubule samples based on the expression of 1,100 randomly picked genes. (b) Kaplan–Meier analysis with log-rank test was used to compare the survival of the 3 different clusters. Renal survival was defined as cases reaching end-stage renal disease or greater than 40% eGFR decline. (c) Single-cell expression enrichment of genes associated with eGFR decline. The heatmap shows the cell-type enrichment of genes associated with eGFR decline (red indicates more genes with cell-type expression). Endo, endothelial cells; Stroma, stromal cells; PEC, parietal epithelial cells; Podo, podocyte; PT, proximal tubule cells; LOH, loop of Henle; DCT, distal convoluted tubule; CNT, connecting tubule; PC, principal cells of collecting duct; IC_A, type alpha intercalated cells. Spatial expression and microenvironment enrichment of genes associated with eGFR decline. GME, glomerular; TME, tubule; FME, fibrosis; IME, immune microenvironment. (d) Using the LASSO regression of all FME genes against eGFR, Kaplan–Meier analysis was re-performed using clustering of subsets of gene—those with a LASSO coefficient that is nonzero and the genes with the most negative coefficients (Supplementary Table 13).
Supplementary Material
Acknowledgements
Work in the Susztak Lab is supported by the National Institutes of Health (NIH; P50DK114786, DK076077, DK087635, DK132630 and DK105821). The study is supported by GSK, Regeneron, Boehringer Ingelheim and Novo Nordisk. The funders have no influence on the reported results. The authors would like to thank the Molecular Pathology and Imaging Core (P30-DK050306) and Diabetes Research Center (P30-DK19525) at the University of Pennsylvania for their services. J.L. is supported by the ASN Ben Lipps Fellowship. B.D. is supported by the Deutsche Forschungsgemeinschaft (DFG; German Research Foundation, grant DU 2449/1-1). K.A.K. is supported by the MOLMED Ph.D. program at the Medical University of Graz, a Marietta-Blau Grant and an Austrian Marshall Plan Foundation scholarship. M.S.B. is supported by grants from the German Research Foundation (DFG, BA 6205/2-1), Else Kröner-Fresenius Foundation, Jackstädt Foundation and the Berlin Institute of Health at Charité - Universitätsmedizin Berlin Clinician Scientist Program.
Footnotes
Code availability
All the codes used for the analysis were deposited on GitHub (https://github.com/amin69upenn/Human_Kidney_Multiomics_and_Spatial_Atlas_ and https://github.com/jlevins2010/FME_atlas).
Competing interests
K.D. and L.M. are employees of Regeneron Pharmaceuticals. G.P., T.B., E.H. and L.S.B. are employees of GSK. S.P., C.M.B. and P.G. are employees of Boehringer Ingelheim. A.K. is an employee of Novo Nordisk. The remaining authors declare no competing interests.
Extended data is available for this paper at https://doi.org/10.1038/s41588-024-01802-x.
Supplementary information The online version contains supplementary material available at https://doi.org/10.1038/s41588-024-01802-x.
Data availability
Raw data, processed data and metadata from the snRNA-seq, scRNA-seq, snATAC–seq and spRNA-seq have been deposited in Gene Expression Omnibus with the accession code GSE211785. The human bulk kidney RNA-seq data are available under the following accession numbers: GSE115098 and GSE173343. The single-cell and nuclear expression and open chromatin and spatial data are also available at www.susztaklab.com (https://susztaklab.com/hk_genemap/).
References
- 1.Gueutin V, Deray G & Isnard-Bagnis C Renal physiology. Bull. Cancer 99, 237–249 (2012). [DOI] [PubMed] [Google Scholar]
- 2.Smith HW The fate of sodium and water in the renal tubules. Bull. N. Y. Acad. Med 35, 293 (1959). [PMC free article] [PubMed] [Google Scholar]
- 3.Vart P et al. National trends in the prevalence of chronic kidney disease among racial/ethnic and socioeconomic status groups, 1988–2016. JAMA Netw. Open 3, e207932 (2020). [DOI] [PMC free article] [PubMed] [Google Scholar]
- 4.Yinusa A, Faezipour M & Faezipour M A study on CKD progression and health disparities using system dynamics modeling. Healthcare 10, 1628 (2022). [DOI] [PMC free article] [PubMed] [Google Scholar]
- 5.Kakitapalli Y, Ampolu J, Madasu SD & Kumar MS Detailed review of chronic kidney disease. Kidney Dis 6, 85–91 (2020). [DOI] [PMC free article] [PubMed] [Google Scholar]
- 6.Balzer MS, Rohacs T & Susztak K How many cell types are in the kidney and what do they do? Annu. Rev. Physiol 84, 507 (2022). [DOI] [PMC free article] [PubMed] [Google Scholar]
- 7.Schreibing F & Kramann R Mapping the human kidney using single-cell genomics. Nat. Rev. Nephrol 18, 347–360 (2022). [DOI] [PubMed] [Google Scholar]
- 8.Balzer MS et al. Single-cell analysis highlights differences in druggable pathways underlying adaptive or fibrotic kidney regeneration. Nat. Commun 13, 4018 (2022). [DOI] [PMC free article] [PubMed] [Google Scholar]
- 9.Miao Z et al. Single cell regulatory landscape of the mouse kidney highlights cellular differentiation programs and disease targets. Nat. Commun 12, 2277 (2021). [DOI] [PMC free article] [PubMed] [Google Scholar]
- 10.Muto Y et al. Single cell transcriptional and chromatin accessibility profiling redefine cellular heterogeneity in the adult human kidney. Nat. Commun 12, 2190 (2021). [DOI] [PMC free article] [PubMed] [Google Scholar]
- 11.Wilson PC et al. The single-cell transcriptomic landscape of early human diabetic nephropathy. Proc. Natl Acad. Sci. USA 116, 19619–19625 (2019). [DOI] [PMC free article] [PubMed] [Google Scholar]
- 12.Young MD et al. Single-cell transcriptomes from human kidneys reveal the cellular identity of renal tumors. Science 361, 594–599 (2018). [DOI] [PMC free article] [PubMed] [Google Scholar]
- 13.Dixon EE, Wu H, Muto Y, Wilson PC & Humphreys BD Spatially resolved transcriptomic analysis of acute kidney injury in a female murine model. J. Am. Soc. Nephrol 33, 279–289 (2022). [DOI] [PMC free article] [PubMed] [Google Scholar]
- 14.Chen TK, Knicely DH & Grams ME Chronic kidney disease diagnosis and management: a review. JAMA 322, 1294–1304 (2019). [DOI] [PMC free article] [PubMed] [Google Scholar]
- 15.Palmer MB et al. The role of glomerular epithelial injury in kidney function decline in patients with diabetic kidney disease in the TRIDENT cohort. Kidney Int. Rep 6, 1066–1080 (2021). [DOI] [PMC free article] [PubMed] [Google Scholar]
- 16.Armutcu F Organ crosstalk: the potent roles of inflammation and fibrotic changes in the course of organ interactions. Inflamm. Res 68, 825–839 (2019). [DOI] [PubMed] [Google Scholar]
- 17.Majo J, Klinkhammer BM, Boor P & Tiniakos D Pathology and natural history of organ fibrosis. Curr. Opin. Pharmacol 49, 82–89 (2019). [DOI] [PubMed] [Google Scholar]
- 18.Deng Z et al. The extracellular matrix and mechanotransduction in pulmonary fibrosis. Int. J. Biochem. Cell Biol 126, 105802 (2020). [DOI] [PubMed] [Google Scholar]
- 19.Humphreys BD Mechanisms of renal fibrosis. Annu. Rev. Physiol 80, 309–326 (2018). [DOI] [PubMed] [Google Scholar]
- 20.Parimon T, Hohmann MS & Yao C Cellular senescence: pathogenic mechanisms in lung fibrosis. Int. J. Mol. Sci 22, 6214 (2021). [DOI] [PMC free article] [PubMed] [Google Scholar]
- 21.Lausecker F, Lennon R & Randles MJ The kidney matrisome in health, aging and disease. Kidney Int 102, 1000–1012 (2022). [DOI] [PubMed] [Google Scholar]
- 22.Zhou D & Liu Y Understanding the mechanisms of kidney fibrosis. Nat. Rev. Nephrol 12, 68–70 (2016). [DOI] [PMC free article] [PubMed] [Google Scholar]
- 23.Grams ME et al. Predicting timing of clinical outcomes in patients with chronic kidney disease and severely decreased glomerular filtration rate. Kidney Int 93, 1442–1451 (2018). [DOI] [PMC free article] [PubMed] [Google Scholar]
- 24.Hallan SI et al. Combining GFR and albuminuria to classify CKD improves prediction of ESRD. J. Am. Soc. Nephrol 20, 1069–1077 (2009). [DOI] [PMC free article] [PubMed] [Google Scholar]
- 25.Neuen BL et al. Changes in GFR and albuminuria in routine clinical practice and the risk of kidney disease progression. Am. J. Kidney Dis 78, 350–360 (2021). [DOI] [PubMed] [Google Scholar]
- 26.An Y et al. Renal histologic changes and the outcome in patients with diabetic nephropathy. Nephrol. Dial. Transplant 30, 257–266 (2015). [DOI] [PubMed] [Google Scholar]
- 27.Rodríguez-Iturbe B, Johnson RR & Herrera-Acosta J Tubulointerstitial damage and progression of renal failure. Kidney Int 68, S82–S86 (2005). [DOI] [PubMed] [Google Scholar]
- 28.Srivastava A et al. The prognostic value of histopathologic lesions in native kidney biopsy specimens: results from the Boston Kidney Biopsy Cohort study. J. Am. Soc. Nephrol 29, 2213–2224 (2018). [DOI] [PMC free article] [PubMed] [Google Scholar]
- 29.Luecken MD et al. Benchmarking atlas-level data integration in single-cell genomics. Nat. Methods 19, 41–50 (2022). [DOI] [PMC free article] [PubMed] [Google Scholar]
- 30.Lake BB et al. An atlas of healthy and injured cell states and niches in the human kidney. Nature 619, 585–594 (2023). [DOI] [PMC free article] [PubMed] [Google Scholar]
- 31.Kleshchevnikov V et al. Cell2location maps fine-grained cell types in spatial transcriptomics. Nat. Biotechnol 40, 661–671 (2022). [DOI] [PubMed] [Google Scholar]
- 32.Wei R et al. Spatial charting of single-cell transcriptomes in tissues. Nat. Biotechnol 40, 1190–1199 (2022). [DOI] [PMC free article] [PubMed] [Google Scholar]
- 33.Thul PJ & Lindskog C The Human Protein Atlas: a spatial map of the human proteome. Protein Sci 27, 233–244 (2018). [DOI] [PMC free article] [PubMed] [Google Scholar]
- 34.Kuppe C et al. Decoding myofibroblast origins in human kidney fibrosis. Nature 589, 281–286 (2021). [DOI] [PMC free article] [PubMed] [Google Scholar]
- 35.Naba A et al. The extracellular matrix: tools and insights for the ‘omics’ era. Matrix Biol 49, 10–24 (2016). [DOI] [PMC free article] [PubMed] [Google Scholar]
- 36.Crow M, Paul A, Ballouz S, Huang ZJ & Gillis J Characterizing the replicability of cell types defined by single cell RNA-sequencing data using MetaNeighbor. Nat. Commun 9, 884 (2018). [DOI] [PMC free article] [PubMed] [Google Scholar]
- 37.Langfelder P & Horvath S WGCNA: an R package for weighted correlation network analysis. BMC Bioinformatics 9, 559 (2008). [DOI] [PMC free article] [PubMed] [Google Scholar]
- 38.Morabito S et al. Single-nucleus chromatin accessibility and transcriptomic characterization of Alzheimer’s disease. Nat. Genet 53, 1143–1155 (2021). [DOI] [PMC free article] [PubMed] [Google Scholar]
- 39.Nirmal AJ et al. The spatial landscape of progression and immunoediting in primary melanoma at single cell resolution. Cancer Discov 12, 1518 (2022). [DOI] [PMC free article] [PubMed] [Google Scholar]
- 40.Sato Y, Tamura M & Yanagita M Tertiary lymphoid tissues: a regional hub for kidney inflammation. Nephrol. Dial. Transplant 38, 26–33 (2021). [DOI] [PubMed] [Google Scholar]
- 41.Jin S et al. Inference and analysis of cell–cell communication using CellChat. Nat. Commun 12, 1088 (2021). [DOI] [PMC free article] [PubMed] [Google Scholar]
- 42.Cang Z et al. Screening cell–cell communication in spatial transcriptomics via collective optimal transport. Nat. Methods 20, 218–228 (2023). [DOI] [PMC free article] [PubMed] [Google Scholar]
- 43.Wilson PC et al. Multimodal single cell sequencing implicates chromatin accessibility and genetic background in diabetic kidney disease progression. Nat. Commun 13, 5253 (2022). [DOI] [PMC free article] [PubMed] [Google Scholar]
- 44.Wu H et al. Mapping the single-cell transcriptomic response of murine diabetic kidney disease to therapies. Cell Metab 34, 1064–1078 (2022). [DOI] [PMC free article] [PubMed] [Google Scholar]
- 45.Kluger AY et al. Class effects of SGLT2 inhibitors on cardiorenal outcomes. Cardiovasc. Diabetol 18, 99 (2019). [DOI] [PMC free article] [PubMed] [Google Scholar]
- 46.Park J et al. Single-cell transcriptomics of the mouse kidney reveals potential cellular targets of kidney disease. Science 360, 758–763 (2018). [DOI] [PMC free article] [PubMed] [Google Scholar]
- 47.Zhang L et al. Genome-wide analysis of histone H3 lysine 4 trimethylation in peripheral blood mononuclear cells of minimal change nephrotic syndrome patients. Am. J. Nephrol 30, 505–513 (2009). [DOI] [PubMed] [Google Scholar]
- 48.Wynn TA & Ramalingam TR Mechanisms of fibrosis: therapeutic translation for fibrotic disease. Nat. Med 18, 1028–1040 (2012). [DOI] [PMC free article] [PubMed] [Google Scholar]
- 49.Djudjaj S & Boor P Cellular and molecular mechanisms of kidney fibrosis. Mol. Aspects Med 65, 16–36 (2019). [DOI] [PubMed] [Google Scholar]
- 50.Liu M & Gomez D Smooth muscle cell phenotypic diversity: at the crossroads of lineage tracing and single-cell transcriptomics. Arterioscler. Thromb. Vasc. Biol 39, 1715–1723 (2019). [DOI] [PMC free article] [PubMed] [Google Scholar]
- 51.Pedroza AJ et al. Single-cell transcriptomic profiling of vascular smooth muscle cell phenotype modulation in Marfan syndrome aortic aneurysm. Arterioscler. Thromb. Vasc. Biol 40, 2195–2211 (2020). [DOI] [PMC free article] [PubMed] [Google Scholar]
- 52.Zhang F, Guo X, Xia Y & Mao L An update on the phenotypic switching of vascular smooth muscle cells in the pathogenesis of atherosclerosis. Cell. Mol. Life Sci 79, 6 (2022). [DOI] [PMC free article] [PubMed] [Google Scholar]
- 53.Aghajanian H et al. Targeting cardiac fibrosis with engineered T cells. Nature 573, 430–433 (2019). [DOI] [PMC free article] [PubMed] [Google Scholar]
- 54.Aghajanian H, Rurik JG & Epstein JA CAR-based therapies: opportunities for immuno-medicine beyond cancer. Nat. Metab 4, 163–169 (2022). [DOI] [PMC free article] [PubMed] [Google Scholar]
- 55.Rurik JG et al. CAR T cells produced in vivo to treat cardiac injury. Science 375, 91–96 (2022). [DOI] [PMC free article] [PubMed] [Google Scholar]
- 56.Song J et al. Understanding kidney injury molecule 1: a novel immune factor in kidney pathophysiology. Am. J. Transl. Res 11, 1219–1229 (2019). [PMC free article] [PubMed] [Google Scholar]
- 57.Zhao J, Gu S & McDermaid A Predicting outcomes of chronic kidney disease from EMR data based on Random Forest Regression. Math. Biosci 310, 24–30 (2019). [DOI] [PMC free article] [PubMed] [Google Scholar]
Associated Data
This section collects any data citations, data availability statements, or supplementary materials included in this article.
Supplementary Materials
Data Availability Statement
Raw data, processed data and metadata from the snRNA-seq, scRNA-seq, snATAC–seq and spRNA-seq have been deposited in Gene Expression Omnibus with the accession code GSE211785. The human bulk kidney RNA-seq data are available under the following accession numbers: GSE115098 and GSE173343. The single-cell and nuclear expression and open chromatin and spatial data are also available at www.susztaklab.com (https://susztaklab.com/hk_genemap/).