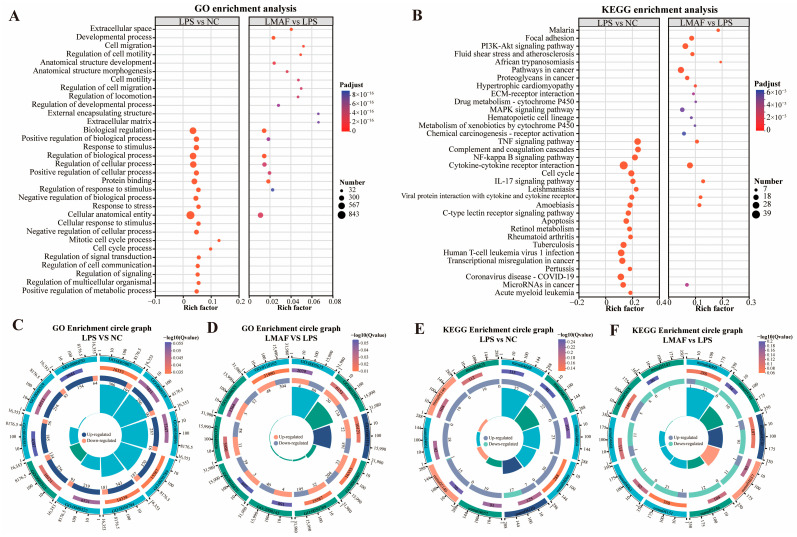
Figure 5.
Enrichment analysis of differentially expressed gene. (A) GO enrichment analysis. (B) KEGG enrichment analysis. Multidimensional GO enrichment circle diagram of LPS versus the NC group (C) and LMAF versus the LPS group (D). Multidimensional KEGG enrichment circle diagram of LPS versus the NC group (E) and LMAF versus the LPS group (F) (n = 3). NC, normal control.

