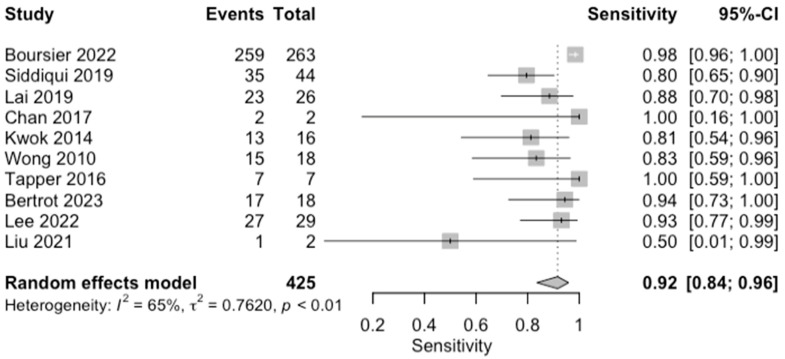
Figure 6.
Forest plots for sensitivity of advanced fibrosis (F0–2 vs. F3–4) along with their 95% confidence intervals (CIs). The plot includes four studies: Boursier 2022 [9], Siddiqui 2019 [10], Lai 2019 [11], Chan 2017 [13], Kwok 2014 [15], Wong 2010 [24], Tapper 2016 [25], Bertrot 2023 [26], Lee 2022 [27], and Liu 2021 [28]. Each study’s sensitivity is represented by a square, with the square size reflecting the study weight in the random effects model. Horizontal lines indicate the 95% CI for each study. The diamond at the bottom represents the pooled sensitivity estimate and its 95% CI, based on the random effects model. Heterogeneity among studies is quantified by I2 (65%) and τ2 (0.7620), with a p-value of 0.01 indicating significant heterogeneity.

