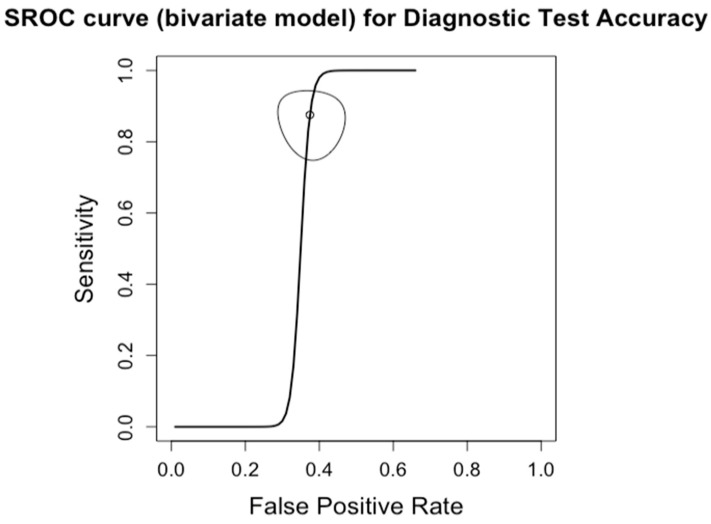
Figure 9.
Summary Receiver Operating Characteristic (SROC) curve for diagnostic test accuracy of cirrhosis (F0–3 vs. F4). The curve plots sensitivity (y-axis) against false positive rate (x-axis), providing an overall measure of test performance across studies. The central curve represents the relationship between sensitivity and false positive rate, while the surrounding shaded region illustrates the 95% confidence region, indicating the variability in diagnostic accuracy.

