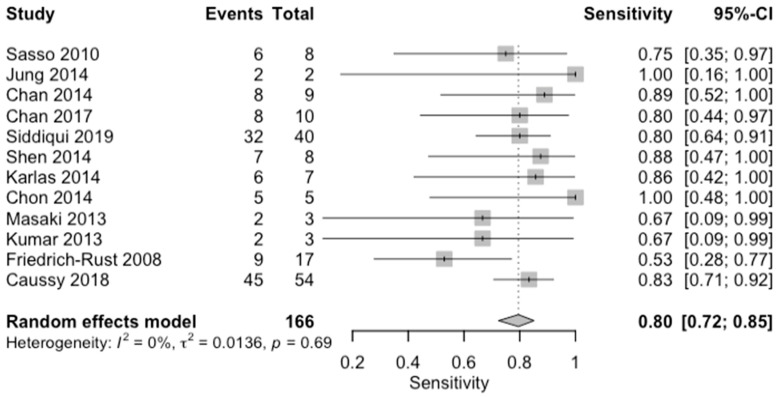
Figure 12.
Forest plots for sensitivity of moderate steatosis (CAP 34–66%, S2) along with their 95% confidence intervals (CIs). The plot includes four studies: Sasso 2010 [16], Jung 2014 [14], Chan 2014 [12], Chan 2017 [13], Siddiqui 2019 [10], Shen 2014 [17], Karlas 2014 [18], Chon 2014 [19], Masaki 2013 [20], Kumar 2013 [21], Friedrich-Rust 2008 [22], and Caussy 2018 [23]. Each study’s sensitivity is represented by a square, with the square size reflecting the study weight in the random effects model. Horizontal lines indicate the 95% CI for each study. The diamond at the bottom represents the pooled sensitivity estimate and its 95% CI, based on the random effects model. Heterogeneity among studies is quantified by I2 (0%) and τ2 (0.0136), with a p-value of indicating low heterogeneity.

