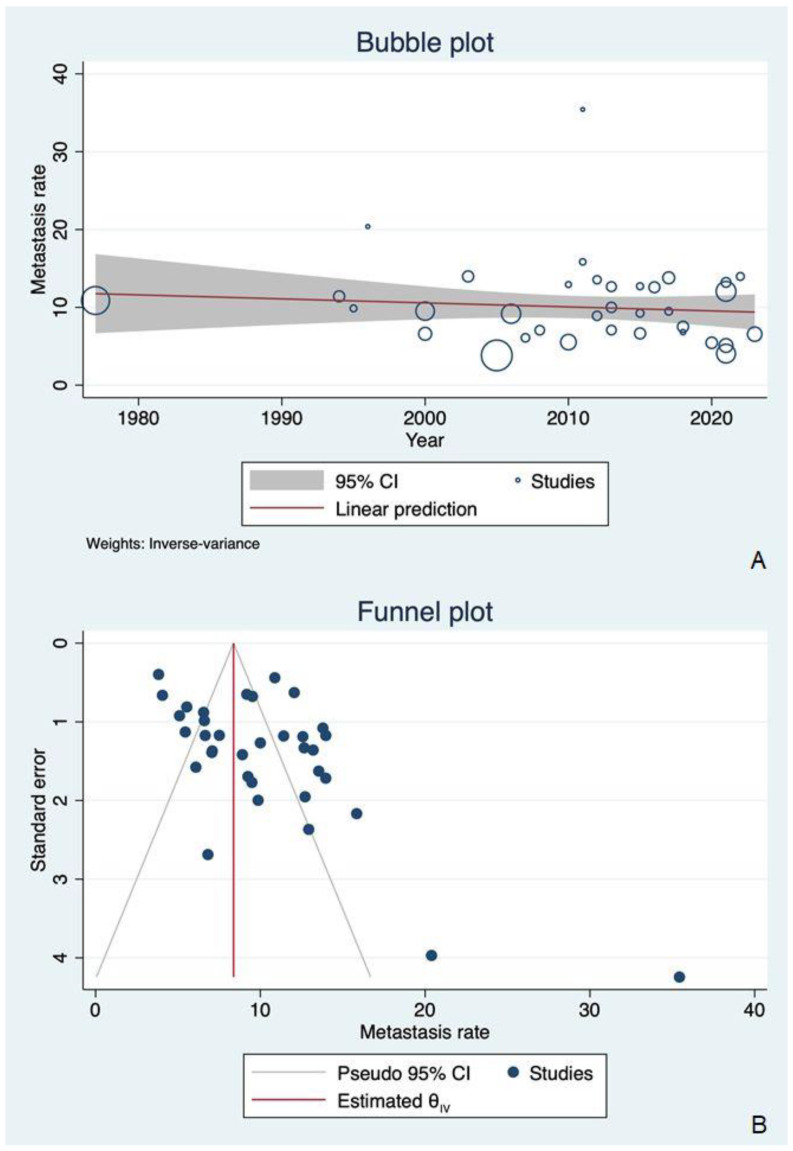
Figure 3.
(A) A bubble plot summarizing the distribution of DM rates by publication year: no significant change in DM rate over time was visible in the included articles (coefficient = −0.0514, R2 = 0.00, p = 0.484). (B) A funnel plot showing a slightly asymmetrical distribution of DM rates, suggesting a possible publication bias. This could reasonably be due to the small study effect.

