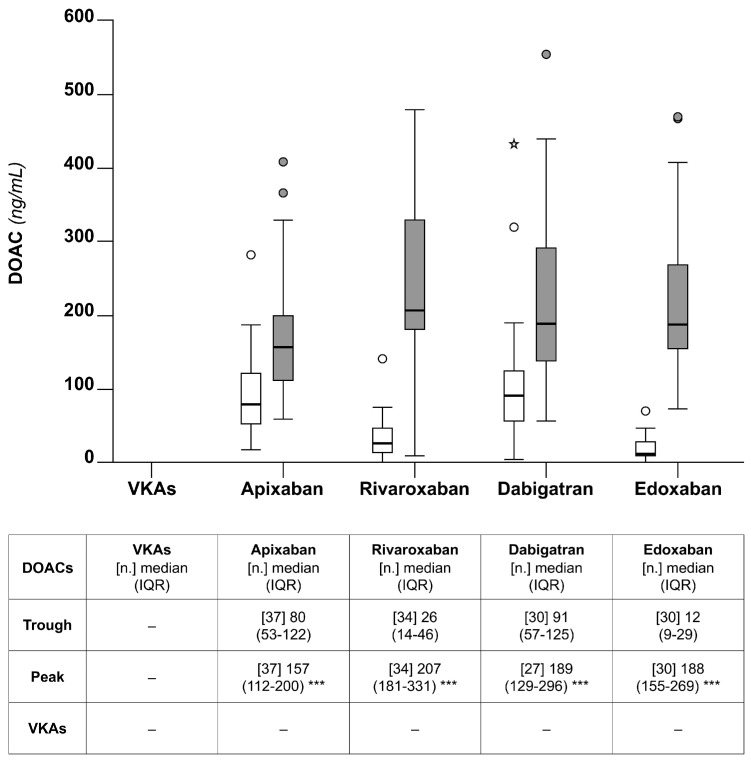
Figure 1.
Box plots of the DOAC concentrations at the peak (grey) and the trough for the chronically anticoagulated patients included in this study. The table reports the numerical results. The p-values (* p < 0.05, ** p < 0.01, *** p < 0.001) refer to the non-parametric test for the paired data (Wilcoxon), trough vs. peak. The p-values (§ p < 0.05, §§ p < 0.01, §§§ p < 0.001) refer to the non-parametric test for the unpaired data (Mann–Whitney), trough or peak vs. VKAs.

