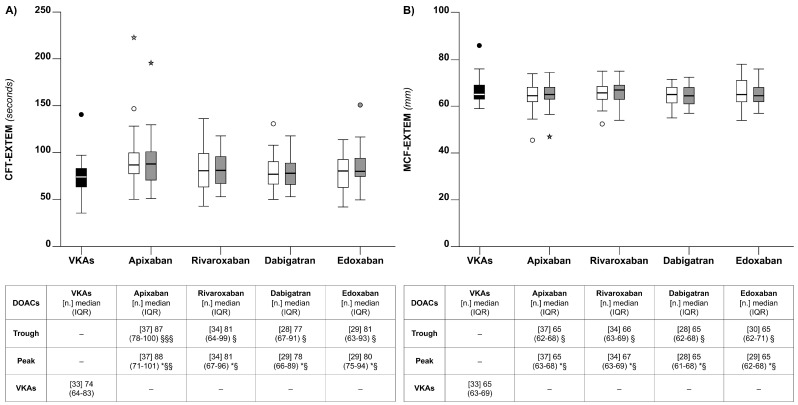
Figure 3.
Box plots of the thromboelastometry parameters clot formation time (CFT) (Panel A) and maximal clot firmness (MCF) (Panel B), observed for the patients on chronic anticoagulation that were included in the study. See also the legends to Figure 1.

