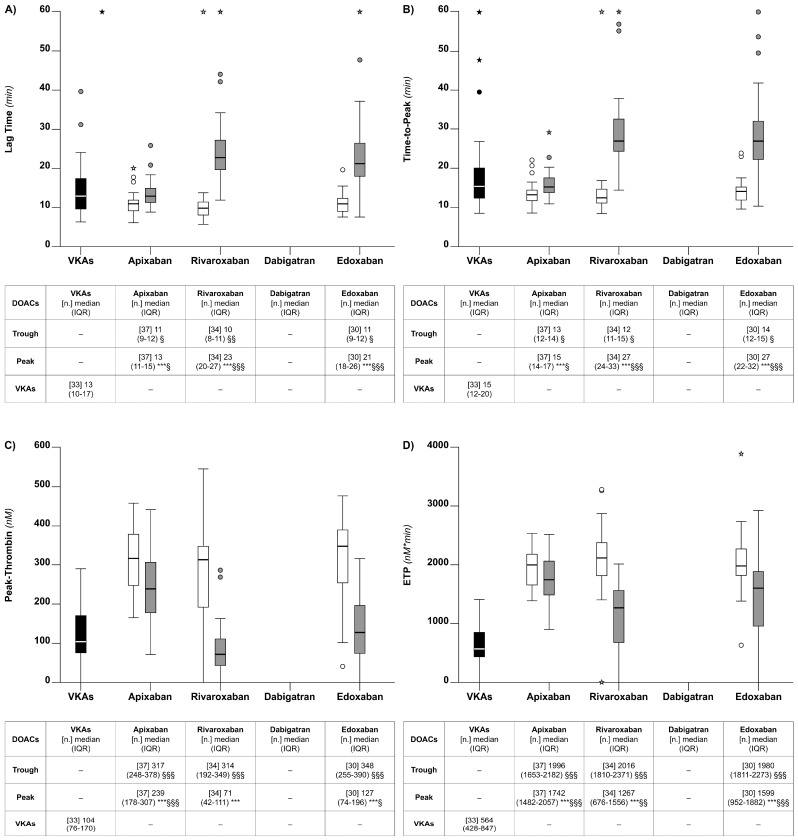
Figure 4.
Box plots of the thrombin generation parameters observed for the patients on chronic anticoagulation that were included in the study. Lag time (Panel A). Time-to-peak (Panel B). Peak-thrombin (Panel C). Endogenous thrombin potential (ETP) (Panel D). See also legends to Figure 1.

