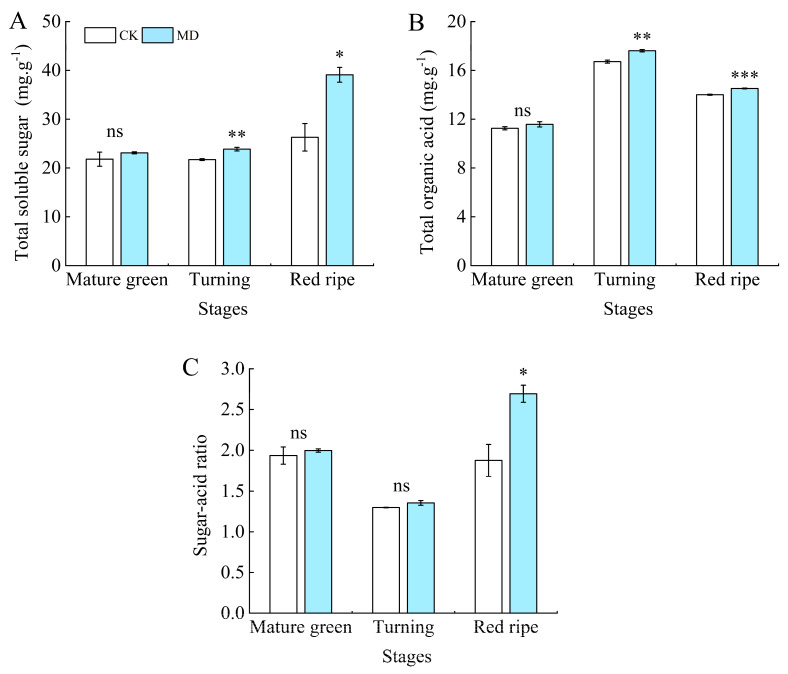
Figure 9.
Effect of moderate water deficit on the content of total soluble sugar, organic acid, and sugar–acid ratio in tomato fruits. (A) Total soluble sugar; (B) total organic acid; (C) sugar–acid ratio. CK: normal irrigation, spontaneously once in 3 days; MD: irrigating once in 6 days. The histogram includes a short vertical line that indicates the mean ± SE (n = 3), while asterisks highlight significant differences between treatments based on the Student’s t-test (* p < 0.05, ** p < 0.01, *** p < 0.001, ns: There was no significant difference).

