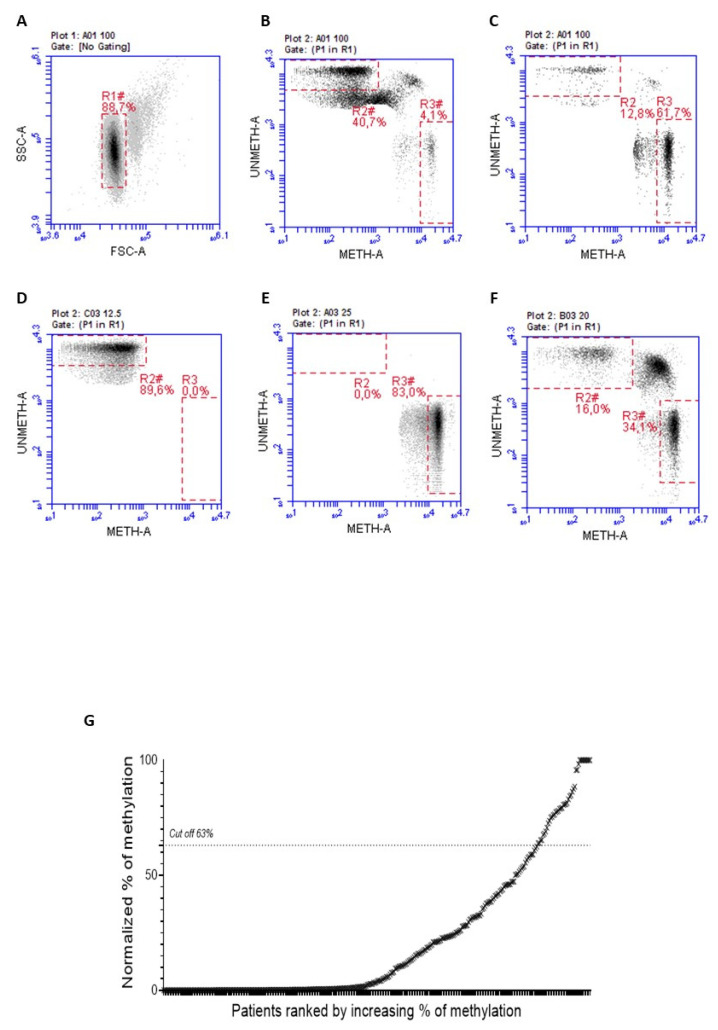
Figure 1.
Representative plots of the gate strategy used for the flow cytometric analysis. (A) ARETHUSA samples analyzed through the Methyl-BEAMing technique were first grouped based on their complexity events. (B) Gate R2 (46.6%) includes unmethylated events, whereas R3 (4.1%) contains methylated ones. (C) The value of 61.7% referred to gate R3 is representative of a methylated sample. (D) Unmethylated sample control (R3 0%). (E) Methylated sample control (R3 83%). (F) The 50% control, obtained by mixing the unmethylated control with the methylated one (R3 34.1%) (G) Methylation profiling of CRC tissue samples assessed by Methyl-BEAMing.

