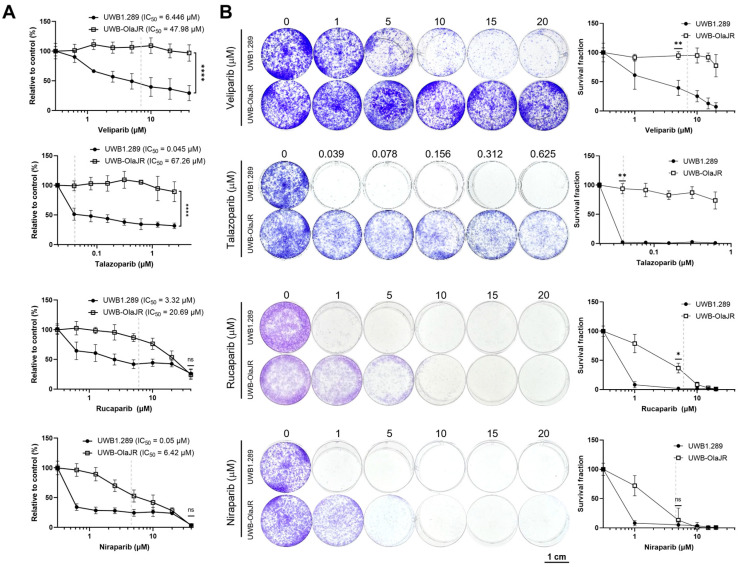
Figure 2.
UWB-OlaJR shows varying degrees of resistance to different PARPis. (A) Cell growth was examined using the XTT assay. UWB-OlaJR cells were treated with veliparib, talazoparib, niraparib, and rucaparib at indicated doses for 5 days. The value 0 was plotted as 0.0195 µM in talazoparib and 0.3125 µM in veliparib, niraparib, and rucaparib for better visualization since 0 cannot be plotted on logarithmic scale. (B) Cell growth was examined by colony-forming assay. Cells were treated with olaparib at indicated doses for 10 days. The value 0 was plotted as 0.0195 µM in talazoparib for better visualization since 0 cannot be plotted on logarithmic scale. Clinically attainable concentrations for each respective agent are denoted by the dotted line on each graph. All experiments were repeated in triplicate. Data are shown as mean ± SD. ****, p < 0.0001; **, p < 0.01; *, p < 0.05; ns, not significant.

