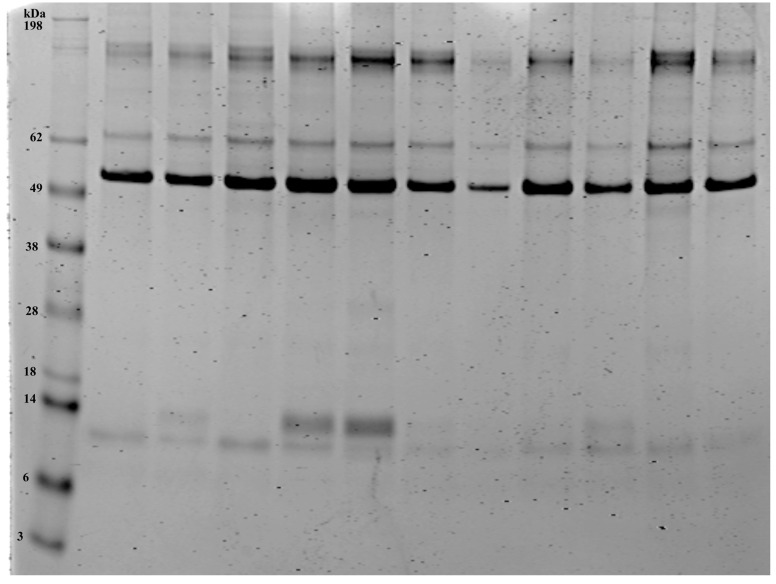
Figure 2.
Total protein stain from the equine bronchoalveolar lavage samples. Lane 1 shows the protein ladder. Total protein stain of the equine BALF samples (Lanes 2–12, 5 µg). Note the diversity of proteins in the BALF samples. The stained gel was imaged using the LICOR Odyssey imager and the associated Image Studio Software, Version 5.2.

