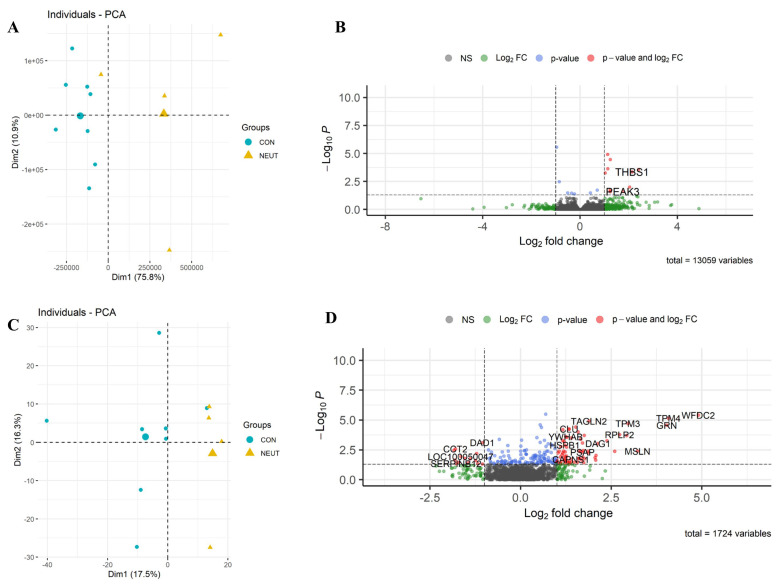
Figure 3.
Differential expression of Group_B_NEUT. Scatterplot of the first two principal components (Dim1 and Dim2) of the RNA-seq (A) and proteomic samples (C) clustered according to their gene and protein expression; in parenthesis: original variance explained by each principal component. The larger symbols represent group means. Volcano plots of differentially expressed genes (B) and proteins (D), identified between Group_B_NEUT (NEUT) and the control group (CON). The green dots denote molecules with an absolute log2-fold change of >1. The blue dots denote genes with FDR ≤ 0.05, and the red dots denote those with FDR ≤ 0.05 and an absolute log2-fold change of >1 (B). In the proteomic dataset, the blue dots denote those with a p-value of ≤0.05, and the red dots denote those with a p-value of ≤0.05 and an absolute log2-fold change of >1 (D). Finally, the grey dots denote gene/protein expression without marked differences.

