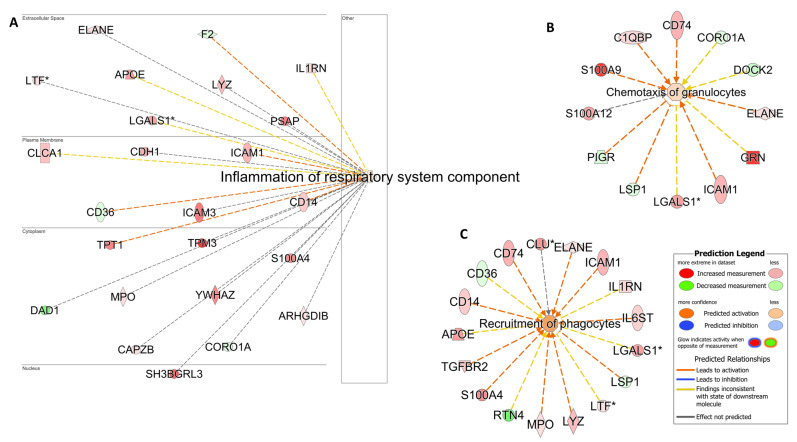
Figure 4.
Airway inflammation and phagocyte cell activation. Pathway analysis identifies networks comprising airway inflammation (A), Chemotaxis of granulocytes (B) and (C) Recruitment of phagocytes. The biological processes and regulators are colored by their predicted activation state: activated (orange) or inhibited (blue). Darker colors indicate higher scores. The edges connecting the nodes are colored orange when leading to the activation of the downstream node, blue when leading to its inhibition, and yellow if the findings underlying the relationship are inconsistent with the state of the downstream node. The pointed arrowheads indicate that the downstream node is expected to be activated if the upstream node connected to it is activated, whereas the blunt arrowheads indicate that the downstream node is expected to be inhibited if the upstream node that connects to it is activated. The molecules in green are downregulated, and those in red are upregulated. The asterisk (*) indicates that multiple identifiers map to the molecule. The analysis was performed using the Ingenuity Pathway Analysis software v24.0.1.

