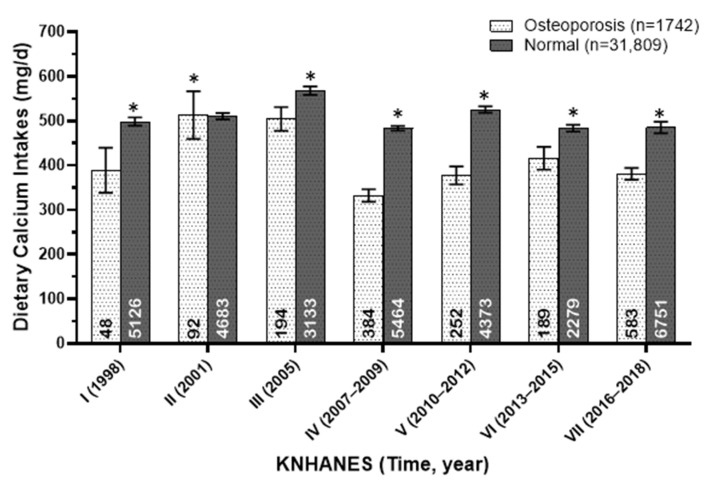
Figure 4.
Dietary calcium intakes (mg/day) of osteoporotic and normal adults in Korea from 1998 to 2018. The annotations at the bottom of each bar represent the number of subjects in each group. An asterisk indicates a significant difference between gender groups at the α = 0.05 level, as determined by the t-test.

