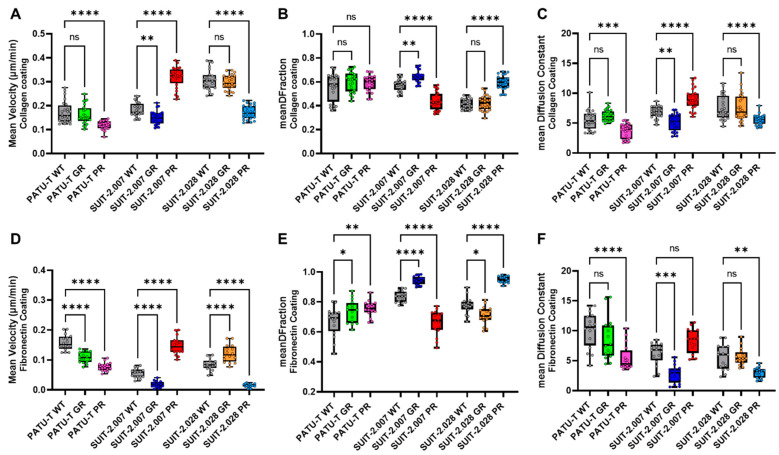
Figure 5.
PDAC resistant single-cell migration is different from parental cells. PDAC single-cell mean velocity (μm/min), growing on (A) collagen-coated or (D) fibronectin-coated wells. The directionality of PDAC cell migration trajectories growing on collagen-coated wells, expressed as (B) diffusive fraction = DF and (C) diffusion constant. The directionality of PDAC cell migration trajectories growing on fibronectin-coated wells, expressed as (E) DF fraction and (F) diffusion constant. All the conditions are represented as boxplots with the smallest and largest values marked, and line at median. The statistical significance was calculated using the parental cells (WT) as the reference group. Each dot represents the population mean for one section of the well. (A–F) Statistical significance was set at p < 0.05 and is indicated by *, p < 0.05; **, p < 0.01; ***, p < 0.001; ****, p < 0.0001, “ns” means not significant.

