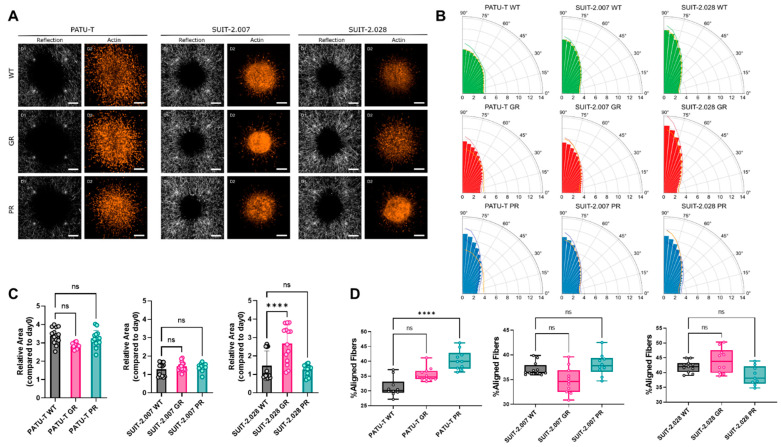
Figure 6.
PDAC chemoresistant cell ability for 3D ECM remodeling and invasion. (A) Representative collagen fibers alignment (left columns), obtained by reflection microscopy, and actin (right columns) of PDAC chemoresistant spheroids. Scale bar: 200 µm (B) Polar plots representing the percentage of the frequency of the distribution of collagen fibers angles from 0° to 90°. Each bar represents the % of fibers in a sector of 5 degrees, expressed as the mean of 2 biological replicates, with at least 4 technical replicates. Lines of the darker shade of the bars represent the upper and lower bounds of SD of the % of collagen fibers in each sector. Orange lines represent the mean % of the frequency of the respective WT for each cell line to facilitate the comparison. (C) Relative area covered by spheroids after 2 days. Dots represent the value of individual spheroids. Data are expressed as mean ± SD. (D) Percentage of aligned fibers, defined as fibers comprised between the angles of 72.5 and 90, which means that those fibers are perpendicular to the closest point of the spheroid. Dots represent the value of individual spheroids. (C,D) Statistical significance was set at p < 0.05 and is indicated by ****, p < 0.0001. “ns” means not significant.

