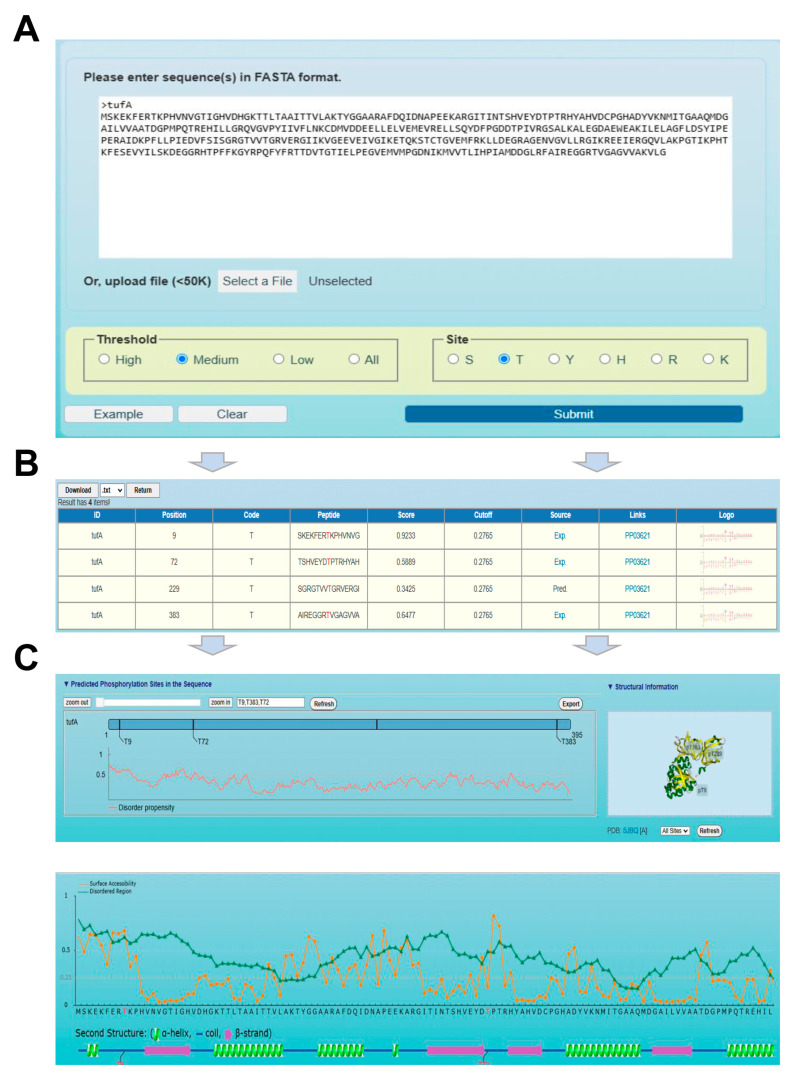
Figure 5.
Usage of the GPS-pPLM web server. (A) The interface of sequence submission. Users can input protein sequences in FASTA format or enter UniProt accession numbers and select 3 different thresholds and 6 different residue types to predict p-sites. (B) Presentation of the prediction results of the example. In the tabular list, the predictive results include the position of the p-site, residue type, prediction score, cut-off value, identification via experimental or computational methods, and links to dbPSP 2.0. (C) Comprehensive annotations of the prediction results. The line chart shows the disorder score of the p-sites, and the location of the p-sites is explained in the 3D structure exported from the PDB database. The ASA score and disorder score of the p-sites are also calculated in the comprehensive mode.

