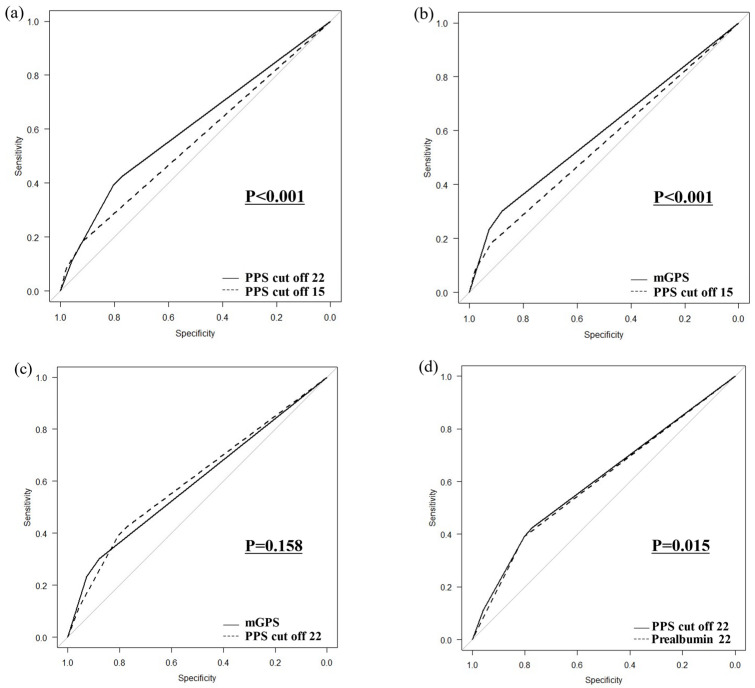
Figure 5.
Comparison of ROC curves (a) between PPSs with prealbumin cutoff values of 15 mg/dL and 22 mg/dL, (b) between the PPS with a prealbumin cutoff of 15 mg/dL and the mGPS, (c) between the PPS with a prealbumin cutoff of 22 mg/dL and the mGPS, and (d) between the PPS with a prealbumin cutoff of 22 mg/dL and prealbumin alone.

