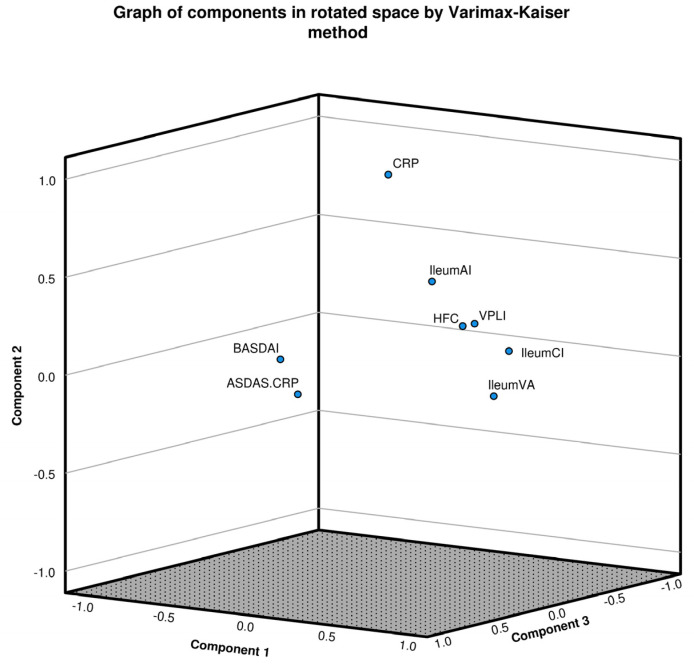
Figure 1.
Factorial analysis of mixed data (FAMD) for high levels of calprotectin, activity indices/biomarkers and microscopic changes. FAMD employs principal component analysis (PCA) and multiple correspondence analysis (MCA) across at least two dimensions. This analysis allows for the grouping of variables with high correlation coefficients (CCs), thereby facilitating the differentiation of patient groups with shared characteristics. Each dimension is represented by a correlation coefficient (CC) from each rotated component (dimension) and a CC of the variable within the group, which ranges from −1.0 to +1.0. A high contribution was considered when CC values were >0.7, intermediate when 0.5–0.7, and values between 0.3 and 0.5 were considered low. All values < 0.3 were not included. The Kaiser-Meyer-Olkin (KMO) Test, which measures sampling adequacy for each variable in the model and values > 0.6, indicated that the sampling was adequate, and Bartlett’s test of sphericity was used to evaluate whether there was a redundancy among the variables that we could summarize with fewer factors, where p values below 0.05 are accepted. In this model, the KMO test result was 0.642, and the Bartlett test p = 0.0001, showed three principal factors that contributed. Dim 1 showed a global CC = 0.837 and grouped micro/macroscopic changes associated with chronic inflammation: vascular pattern loss in ileum (CC 0.772), VA in ileum (0.780), microscopic chronic infiltration of the ileum (0.773) and HFC (0.678), all of them with a global dimension CC of 0.837. Dim 2 showed a global CC of 0.792 and was represented by levels of CRP > 3.0 mg/L (0.841) and microscopic acute inflammation (CC = 0.7728). Finally, Dim 3 showed a global CC of 0.914, grouping activity scores ASDAS-CRP > 2.1 (0.876) and BASDAI > 4.0 (0.812). In spite of HFC’s inclusion in Dim 1, this variable had a CC of 0.332 in the Dim 2, which was graphically observable.

