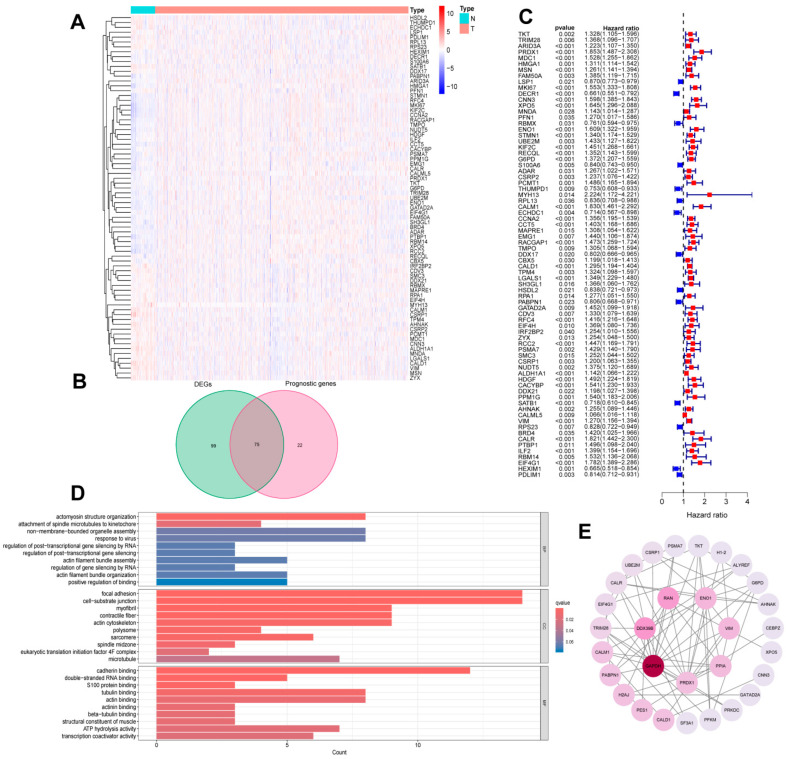
Figure 2.
Identification of prognostic lactylation-related genes in BLAC. (A) A heatmap presenting the expression levels of the lactylation-related DEGs. (B) A Venn diagram showing the quantities of the prognostic genes and DEGs. (C) A forest plot of prognostic lactylation-related DEGs. (D) A bar plot of GO analysis based on DEGS. (E) A PPI network showing known and predicted interactions of proteins and genes among the prognostic lactylation-related DEGs.

