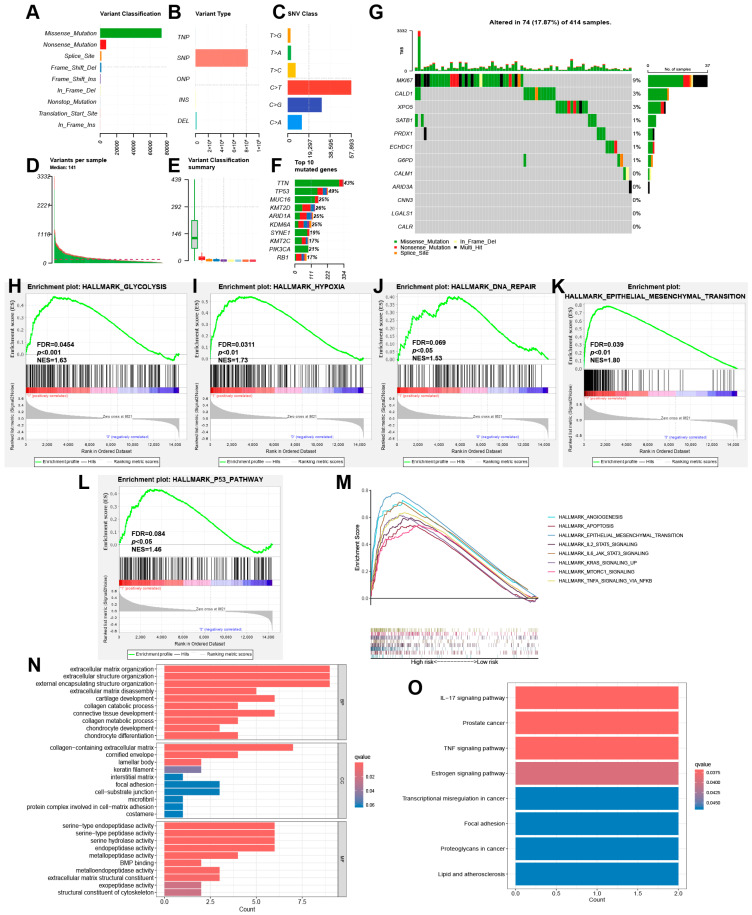
Figure 6.
Mutation analysis and functional enrichment analysis. (A) Variant classification in BLAC. (B) Variant type in BLAC. (C) Single-nucleotide variation class in BLAC. (D) Variants per sample in BLAC. (E) Variant classification summary in BLAC. (F) Top 10 mutated genes in BLAC. (G) Waterfall plot of mutation frequencies of 12 model genes. (H–M) Highly expressed GSEA pathway in high-risk group. (N) GO analysis based on differentially expressed genes between high- and low-risk groups. (O) KEGG analysis based on differentially expressed genes between high- and low-risk groups.

