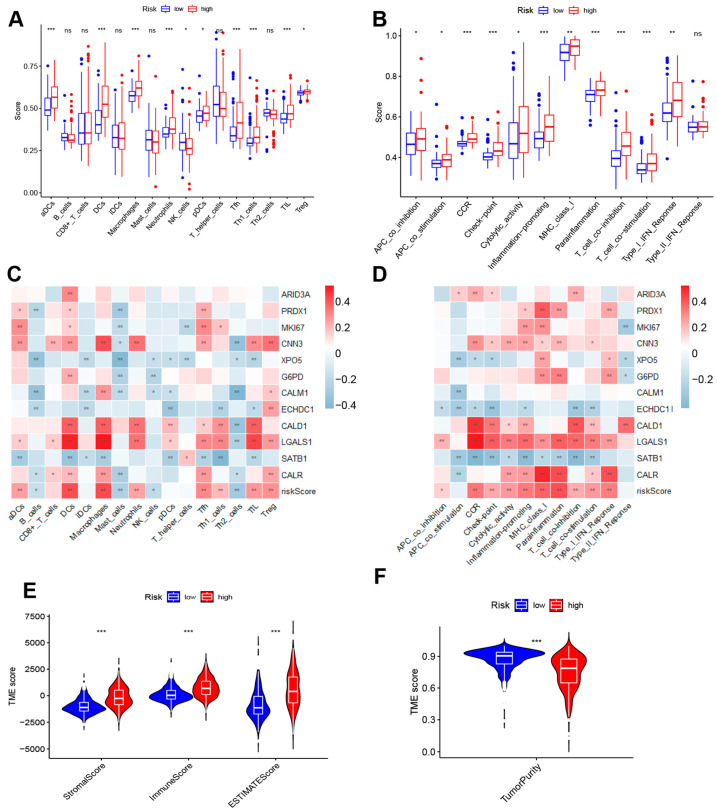
Figure 7.
Tumor immune microenvironment analysis (A,B) Comparison of immune infiltration and immune function between high- and low-risk groups. (C) Heatmap of relationship between 12 model genes, risk scores, and immune infiltration (* p < 0.05, ** p < 0.01, *** p < 0.001). (D) Heatmap of relationship between 12 model genes, risk scores, and immune function (* p < 0.05, ** p < 0.01, *** p < 0.001). (E) StromalScore, ImmuneScore, and ESTIMATEScore of high- and low-risk groups based on ESTIMATE analysis. (F) Tumor purity in high- and low-risk groups based on ESTIMATE analysis.

