Figure 9.
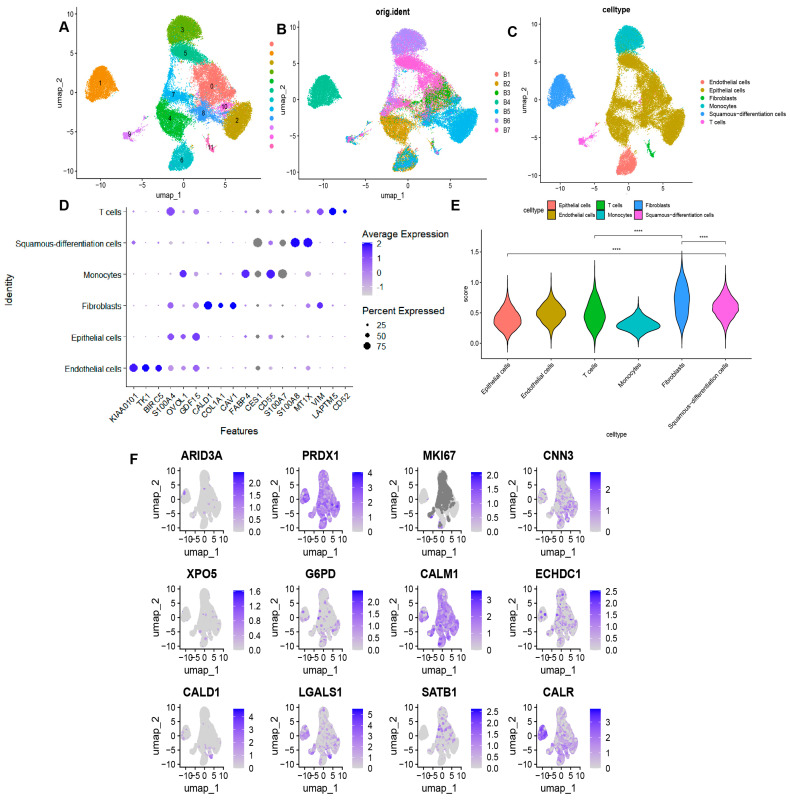
Single-cell RNA-seq profiling in BLAC. (A) Umap for dimensionality reduction of data derived from BLAC tissues. (B) Umap showing integration of 7 single cell tissue samples. (C) Annotation of each cell cluster by singleR and manual annotation. (D) Bubble map showing expression of marker genes in each cell type. (E) Scores for each cell population based on signature of 12 genes. **** p < 0.0001. (F) Expression of 12 model genes in each cell type.

